Tweezer Top
Bearish Reversal PatternWhat is Tweezer Top Pattern?
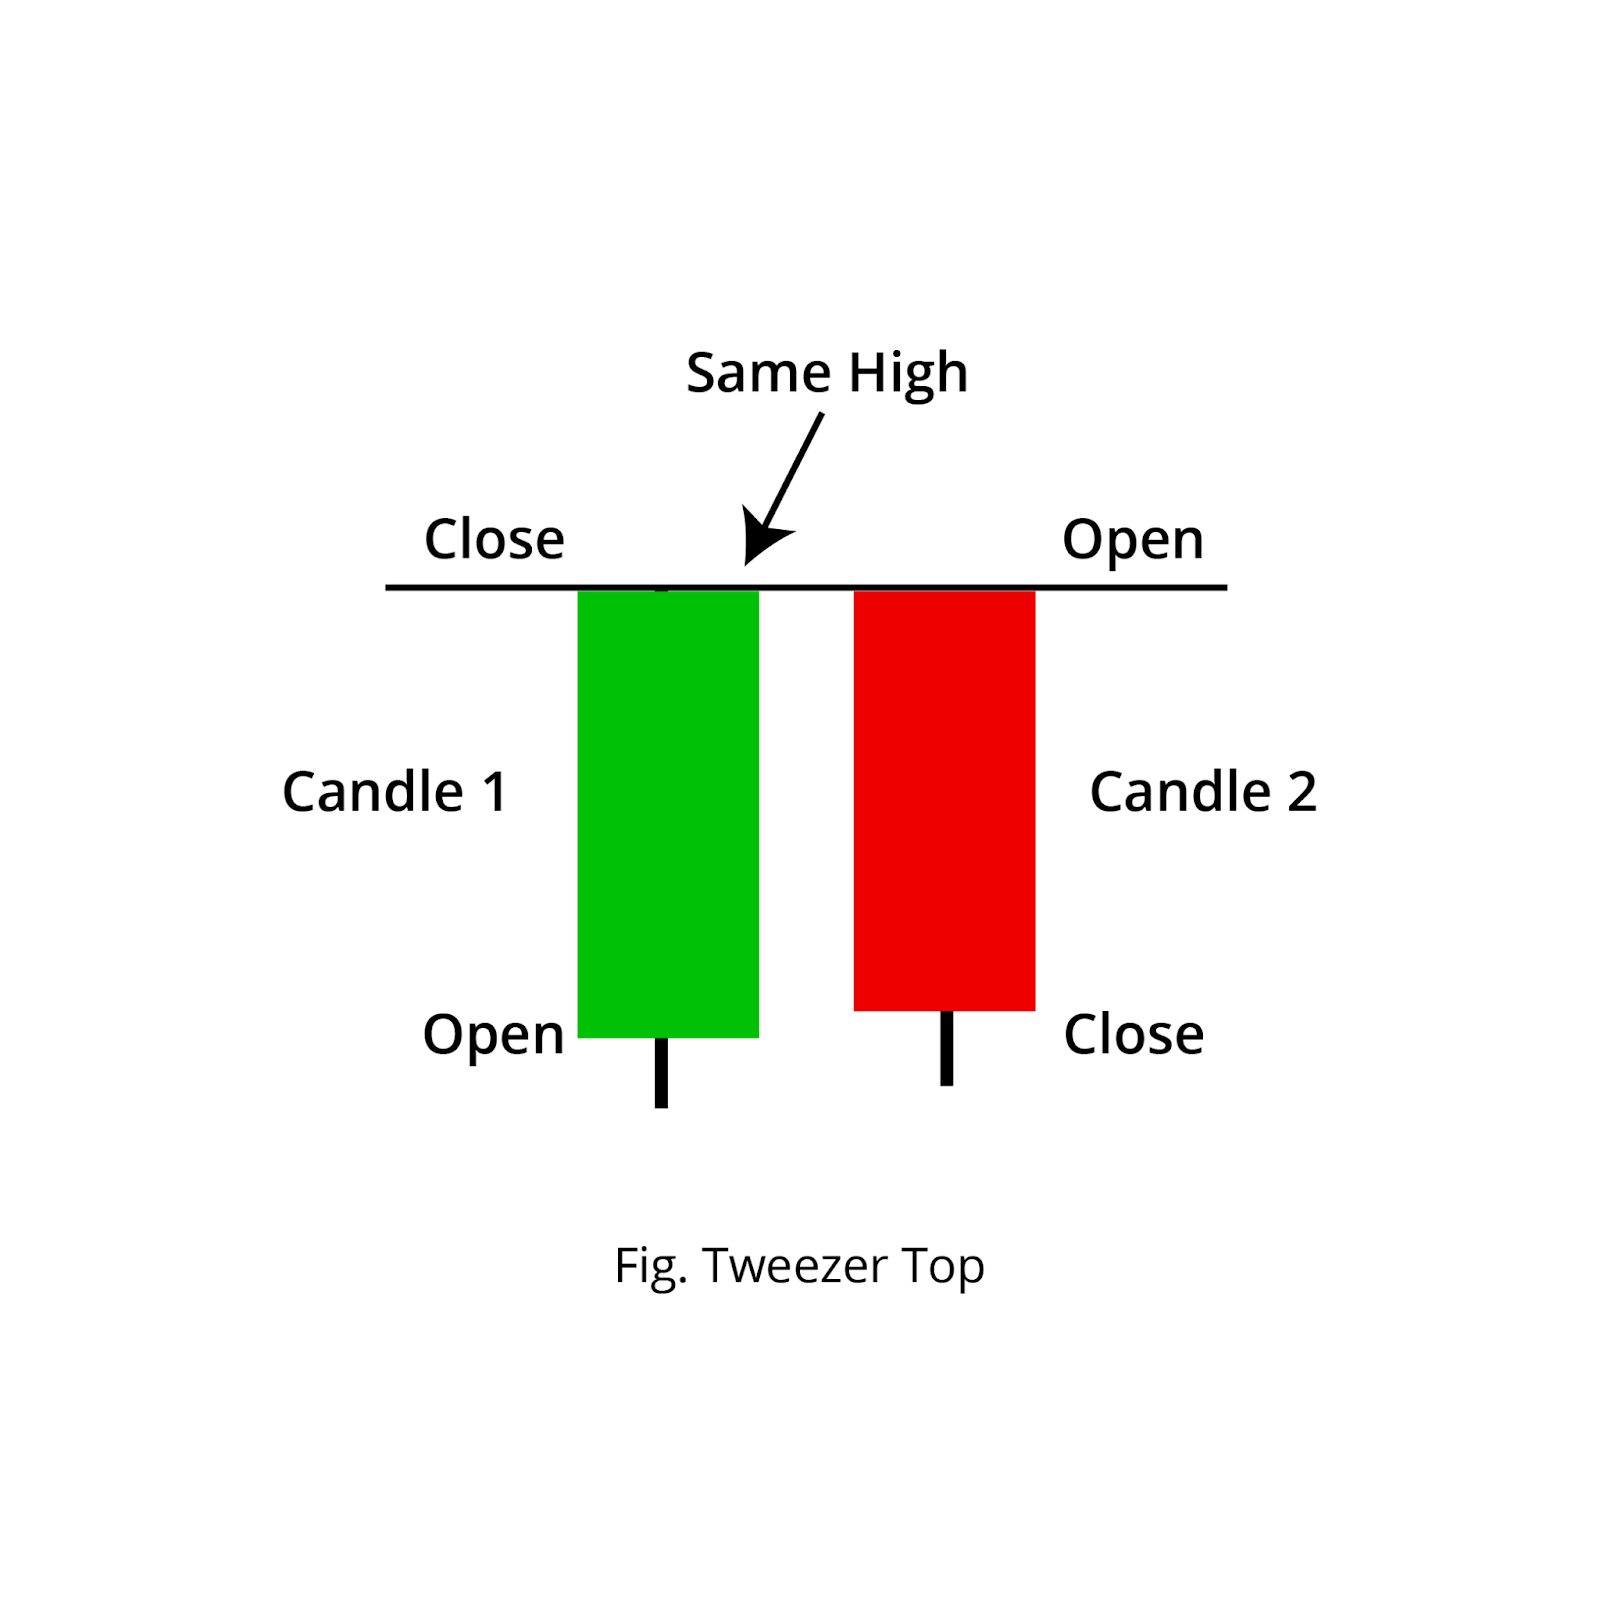
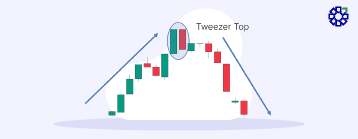
Tweezer Top is a bearish reversal candlestick pattern that appears after an uptrend. It consists of two candles with identical (or nearly identical) highs, signaling that buyers attempted twice to push prices higher but failed, allowing sellers to take control.
Structure of the Pattern
- Two consecutive candlesticks.
- First candle: Bullish (close > open), reflecting continued buying pressure.
- Second candle: Bearish (close < open), showing selling pressure.
- Both candles have mathematically equal highs (exact price match).
Key Conditions for Formation
- Must occur after a clear uptrend.
- First candle must be bullish, second bearish.
- Highs of both candles must be exactly equal (no tolerance).
- Optional but strengthens signal: long upper wicks on either candle indicating rejection at the high.
Detailed Explanation
The Tweezer Top represents a struggle between buyers and sellers at a specific price level. The first bullish candle shows that buyers are still pushing prices up. The second candle opens near the previous close but fails to break above the prior high, then closes lower, indicating that sellers have stepped in aggressively.
The identical highs create a double rejection at the same resistance level, increasing the likelihood of a trend reversal.
- Exact equality of highs is critical for strict pattern detection.
- Long upper shadows on either candle add confirmation.
- Higher volume on the second candle strengthens the signal.
Market Psychology
The psychology behind Tweezer Top involves two failed attempts to push prices higher:
- First candle: Buyers are confident and push price up, closing near the high.
- Second candle: Buyers try again but fail to exceed the previous high, and sellers take over, driving price down.
- The equal highs show that the resistance level is strong, leading to a reversal in sentiment.
Trade Interpretation
- Entry: Short (sell) after the close of the second bearish candle.
- Confirmation: A close below the low of the pattern or further bearish candles.
- Stop Loss: Place above the identical highs.
- Target: Key support levels or a risk-reward ratio of at least 1:2.
Timeframe Relevance (Algo Context)
- In a 5-minute timeframe environment:
- Pattern forms over 2 consecutive candles (10 minutes).
- Signal becomes active after the second candle closes.
- Remains valid for the next 1-2 candles or until the high is broken.
Role of Volume
Volume analysis can improve pattern reliability:
- Increasing volume on the second (bearish) candle confirms selling pressure.
- Lower volume on the first candle suggests weaker buying conviction.
Using Indicators for Confirmation
Combine with technical indicators to filter false signals:
- RSI: Overbought conditions (above 70) with bearish divergence.
- MACD: Bearish crossover on the histogram.
- Support/Resistance: Pattern occurring at a known resistance zone is more reliable.
When to Avoid
- In strong trending markets without any pullback.
- When the pattern appears in a sideways or consolidating market.
- If the second candle has a very small body or is a doji (weak reversal signal).
- During major news events or low liquidity conditions.
Precautions
- Always use stop-loss orders above the pattern highs.
- Wait for third candle confirmation (e.g., a bearish close below the first candle's low).
- Avoid trading solely based on tweezer tops without trend context.
- Use exact price equality in algorithmic detection; avoid tolerance to reduce false positives.
Related Patterns
- Tweezer Bottom (bullish counterpart)
- Double Top (chart pattern)
- Evening Star
- Bearish Engulfing
Practical Insights
In algorithmic trading:
- Use strict equality check for highs (prev['high'] == curr['high']).
- Ensure uptrend is present using moving averages or higher timeframe analysis.
- Filter duplicate signals (e.g., only the most recent tweezer top in a short window).
Example Scenario
A stock rallies from ₹100 to ₹120 over several days. On day 1, a bullish candle closes at ₹119 with a high of ₹120. On day 2, the stock opens at ₹118, rallies to ₹120 again but fails to break higher, then closes at ₹116. The highs are exactly ₹120 both days. This Tweezer Top signals that ₹120 is strong resistance, and a bearish reversal is likely.
SUMMARY
- Pattern Type: Bearish Reversal
- Candles Required: 2
- Key Signal: Two consecutive candles with equal highs; first bullish, second bearish
- Best Use Case: After an uptrend near resistance
- Confirmation Needed: Yes (follow-through bearish candle)
- Reliability: High when strict equality is enforced