Rising Window
Bullish Continuation PatternWhat is Rising Window Pattern?
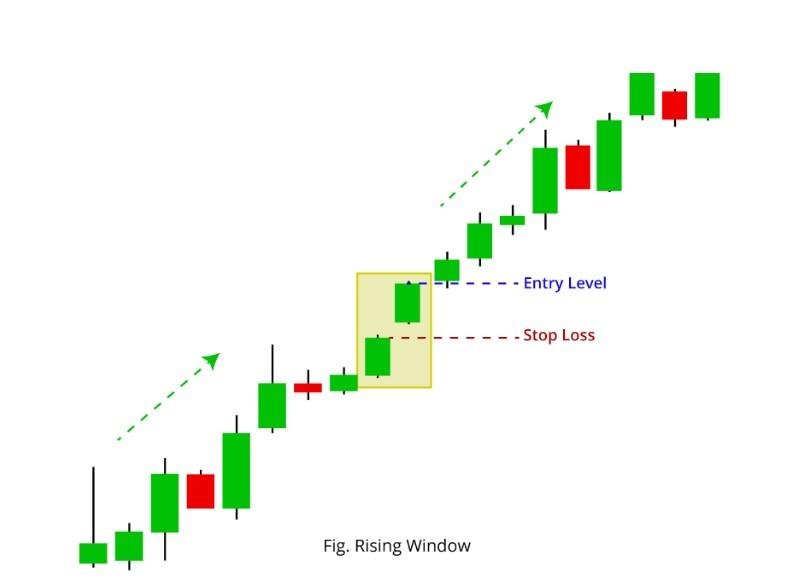
Rising Window is a bullish continuation candlestick pattern that indicates strong buying momentum and a likely continuation of an existing uptrend. It is formed when there is a gap-up between two consecutive candles, such that the second candle opens above the high of the previous candle, leaving a visible gap (window) on the chart. This gap reflects strong demand and aggressive participation by buyers.
Structure of the Pattern
The Rising Window pattern consists of two consecutive candles:
- Candle 1: A bullish or neutral candle that is part of an ongoing uptrend.
- Candle 2: A candle that opens above the high of Candle 1, creating a gap (window), and continues trading above that level.
Key Conditions for Formation
- The pattern must occur during a clear uptrend.
- A gap-up must exist between the first and second candle (no overlap between high of first and low of second).
- The gap should remain unfilled (price should not retrace into the gap immediately).
- The second candle should ideally maintain strength and not close weakly.
- The gap acts as a support zone going forward.
Detailed Explanation
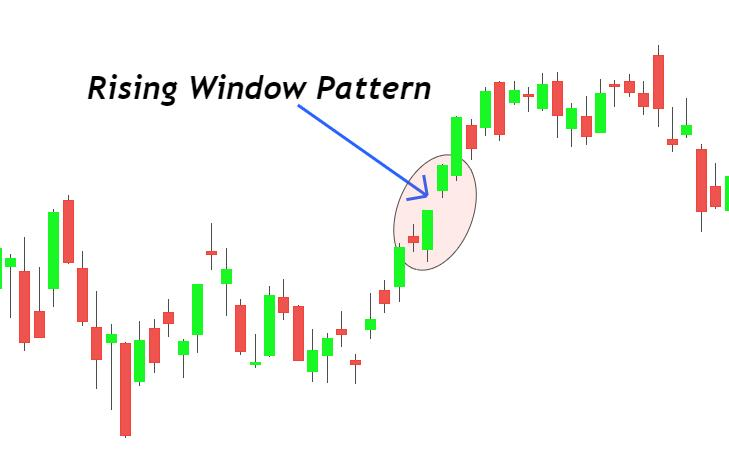
The Rising Window pattern represents a surge in buying interest where demand is so strong that the market opens significantly higher than the previous close. This creates a gap, indicating that buyers are willing to pay higher prices without waiting for pullbacks.
The gap itself becomes a key technical level. As long as the price stays above this window, the bullish momentum is considered intact. If the gap remains unfilled, it reinforces the strength of the uptrend and suggests continuation.
The reliability of the pattern increases when:
- The gap is large and clearly visible.
- The pattern appears after a strong uptrend.
- Subsequent candles continue moving upward.
- The gap remains unfilled for multiple candles.
Market Psychology
This behavior signals confidence and continuation rather than hesitation or reversal.
The psychology behind the Rising Window pattern reflects strong bullish conviction:
- Buyers dominate the market and push prices higher aggressively.
- There is urgency among buyers, leading to a gap-up opening.
- Sellers are unable to push prices back into the gap.
- The gap becomes a support zone where buyers are likely to step in again.
Trade Interpretation
- Entry: Traders typically look to enter long positions near the gap area or after confirmation of continued upward movement.
- Confirmation: Price holding above the gap and continuing upward confirms strength.
- Stop Loss: Usually placed below the gap (below the low of the second candle).
- Target: Targets are set based on resistance levels or trend continuation strategies.
Timeframe Relevance (Algo Context)
In a 5-minute timeframe environment:
- The pattern forms over 2 candles (10 minutes total).
- It becomes active immediately after the second candle forms.
- The gap remains relevant as support for the next few candles.
- Quick validation is important due to short-term volatility.
Role of Volume
Volume helps validate the strength of the pattern:
- Increased volume during the gap-up indicates strong buying interest.
- Sustained volume after the gap supports continuation.
- Low volume may indicate a weak or false breakout.
Using Indicators for Confirmation
To improve reliability, traders combine the Rising Window pattern with technical indicators:
- RSI: Should support bullish momentum (not overextended).
- MACD: Bullish crossover or continuation strengthens the signal.
- Volume: Rising volume confirms participation.
When to Avoid
- When the gap is quickly filled (weak signal).
- In sideways or choppy markets.
- When the gap occurs due to sudden news spikes without follow-through.
- When volume does not support the move.
Precautions
- Avoid entering immediately without confirmation of strength.
- Always monitor if the gap is being filled.
- Use stop-loss strictly below the gap.
- Combine with trend analysis and indicators for better accuracy.
Related Patterns
- Falling Window (bearish counterpart)
- Breakaway Gap
- Runaway Gap
- Continuation Patterns
Practical Insights
In algorithm-based detection systems:
- The pattern is identified using OHLC data by detecting gap-up conditions.
- Validation ensures the gap is not immediately filled.
- Signals are marked active while the price stays above the gap.
- The gap zone is treated as dynamic support.
- Duplicate signals are filtered within a short interval.
Example Scenario
Consider a stock in a strong uptrend where a bullish candle is followed by a new candle that opens significantly above the previous high. The price continues to trade above this gap, showing sustained strength. This indicates that buyers are aggressively pushing prices higher, and the trend is likely to continue.
SUMMARY
- Pattern Type: Bullish Continuation
- Candles Required: 2
- Key Signal: Gap-up with no overlap
- Best Use Case: During strong uptrend
- Confirmation Needed: Yes (Follow-through candles)
- Reliability: High when gap remains unfilled and volume supports