Ladder Top
Bearish Reversal PatternWhat is Ladder Top Pattern?
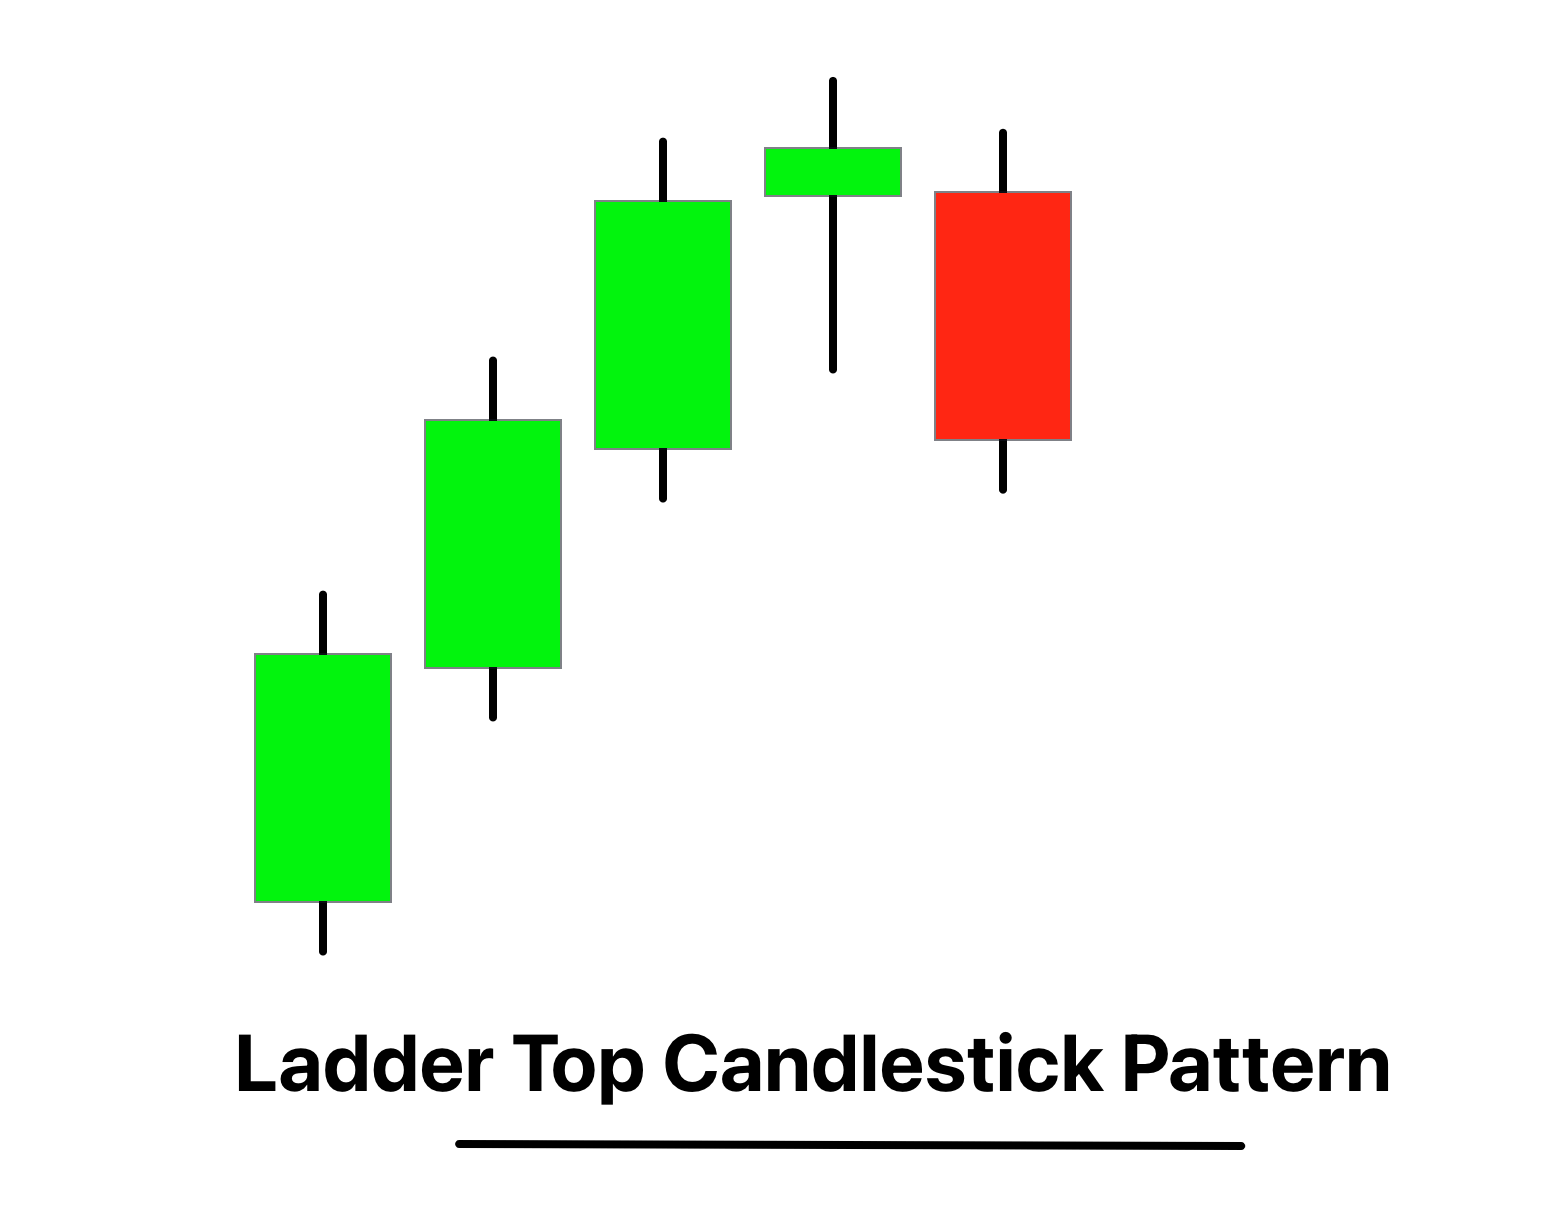
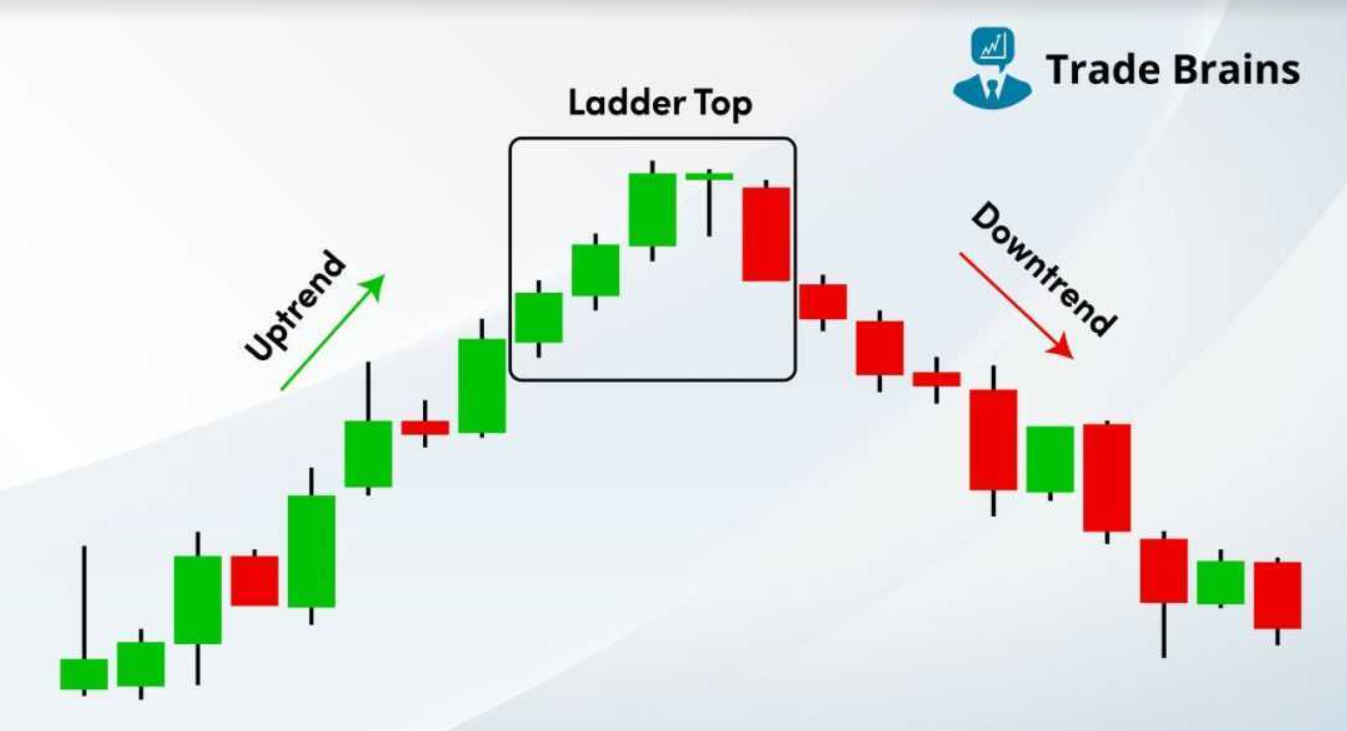
Ladder Top is a bearish reversal candlestick pattern that appears at the end of an uptrend. It consists of a series of rising bullish candles followed by a candle showing rejection at higher levels and a strong bearish candle, indicating that buying pressure is weakening and sellers are taking control.
Structure of the Pattern
- The pattern consists of five candles:
- Candle 1-3: Consecutive bullish candles showing continued buying pressure.
- Candle 4: A bullish candle with a long upper shadow indicating rejection of higher prices.
- Candle 5: A strong bearish candle that closes below previous candles.
- The pattern forms a step-like upward structure followed by reversal.
Key Conditions for Formation
- The pattern must occur after a clear uptrend.
- There should be consecutive bullish candles.
- The fourth candle should show a long upper shadow (rejection).
- The fifth candle must be strongly bearish.
- The pattern should indicate weakening bullish momentum.
Detailed Explanation
The Ladder Top pattern reflects gradual exhaustion of buyers. The initial candles show strong bullish sentiment, but the long upper shadow in the fourth candle indicates rejection of higher prices.
The final bearish candle confirms that sellers have entered the market and are pushing prices lower, signaling a potential reversal.
- Gradual rise shows sustained buying pressure.
- Upper shadow indicates rejection at higher levels.
- Final bearish candle confirms reversal.
- Pattern often marks the top of a trend.
Market Psychology
The psychology behind the Ladder Top pattern reflects a slow transition from bullish to bearish sentiment.
- Buyers dominate initially with consecutive gains.
- Momentum begins to weaken as buying pressure reduces.
- Sellers start entering at higher levels.
- Final bearish candle confirms shift in control.
Trade Interpretation
- Entry: After the bearish confirmation candle.
- Confirmation: Strong bearish fifth candle.
- Stop Loss: Above the highest point of the pattern.
- Target: Based on support levels or trend continuation.
Timeframe Relevance (Algo Context)
- In a 5-minute timeframe:
- Pattern forms over 5 candles (25 minutes).
- Becomes active after the fifth candle.
- Useful for identifying reversal zones.
- Works best in trending markets.
Role of Volume
- Volume helps validate the pattern:
- Decreasing volume during rise indicates weakening buyers.
- High volume on bearish candle confirms reversal.
- Volume spike increases reliability.
Using Indicators for Confirmation
- RSI: Look for overbought conditions.
- MACD: Bearish crossover strengthens signal.
- Resistance Levels: Pattern near resistance increases reliability.
- Volume: Rising volume confirms reversal.
When to Avoid
- When there is no clear uptrend.
- When the bearish candle is weak.
- In sideways or low-volume markets.
- When confirmation is missing.
Precautions
- Wait for confirmation before entering trade.
- Do not rely solely on pattern.
- Use stop loss for risk management.
- Combine with indicators for accuracy.
Related Patterns
- Three Black Crows
- Evening Star
- Shooting Star
- Three Inside Down
Practical Insights
In algorithm-based detection systems:
- Detect consecutive bullish candles.
- Identify long upper shadow in fourth candle.
- Confirm strong bearish reversal candle.
- Validate prior uptrend for accuracy.
Example Scenario
A stock rises steadily with multiple bullish candles. A candle with a long upper shadow appears, followed by a strong bearish candle, indicating that buyers are losing control and a downtrend may begin.
SUMMARY
- Pattern Type: Bearish Reversal
- Candles Required: 5
- Key Signal: Gradual rise + bearish reversal
- Best Use Case: End of uptrend
- Confirmation Needed: Yes
- Reliability: Medium to High