Inverted Hammer
Bullish Reversal PatternWhat is Inverted Hammer Pattern?
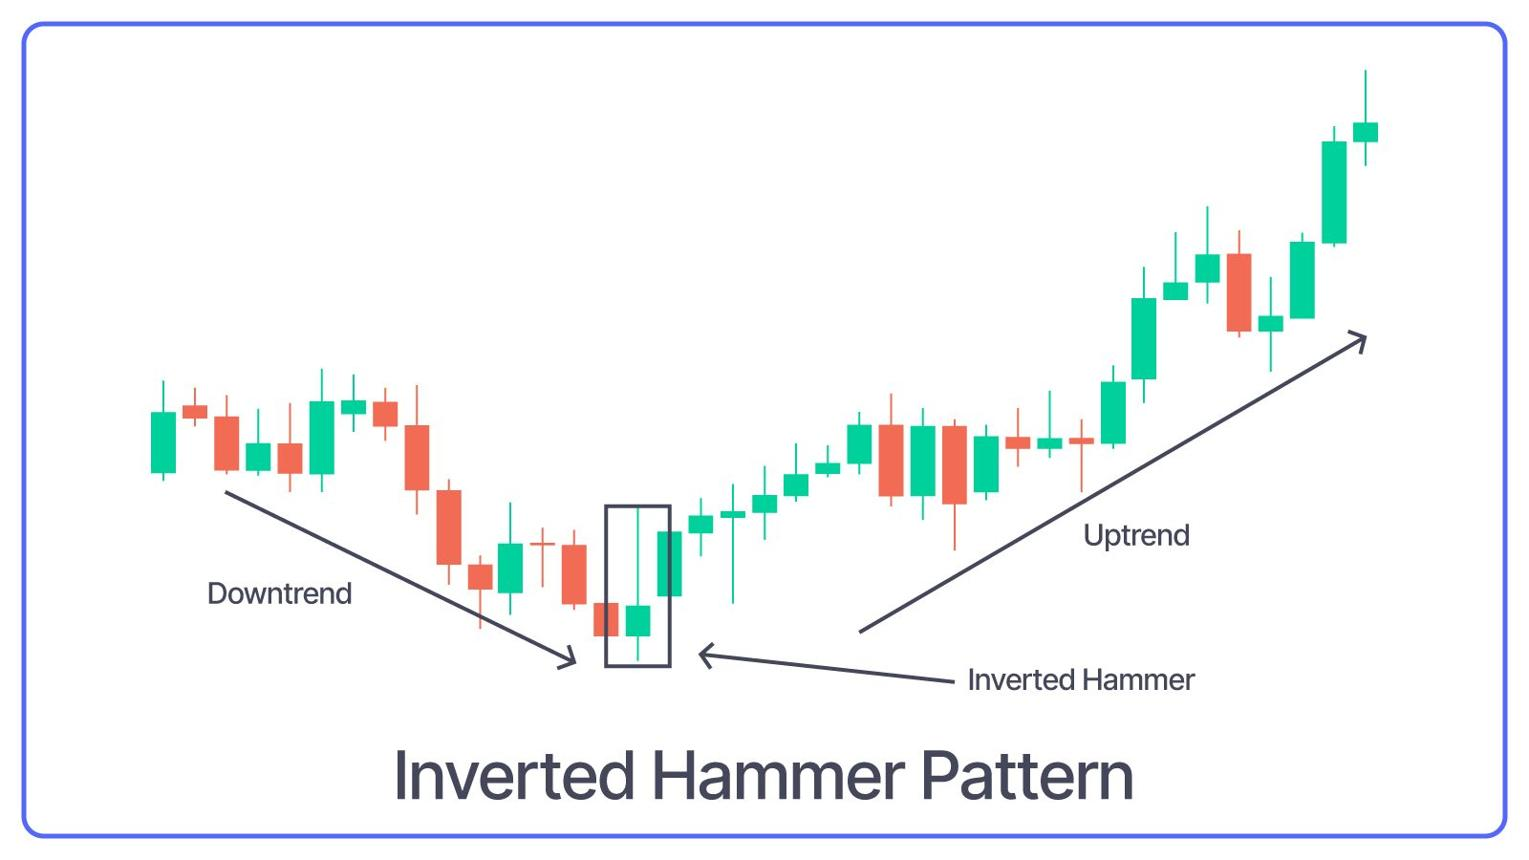
Inverted Hammer is a bullish reversal candlestick pattern that signals a potential shift from a downtrend to an uptrend. It typically appears after a sustained decline and indicates that buying interest is starting to emerge, even though sellers initially attempted to push prices lower.
Structure of the Pattern
The Inverted Hammer pattern consists of a single candlestick with the following characteristics:
- Body: A small real body (bullish or slightly bearish) positioned near the lower end of the candle range.
- Upper Shadow: A long upper shadow, typically at least two times the size of the body, indicating strong upward price rejection during the session.
- Lower Shadow: Very small or negligible lower shadow, showing that price closed near its opening level.
Key Conditions for Formation
- The pattern must form after a clear and sustained downtrend.
- The upper shadow should be significantly longer than the body.
- The lower shadow should be minimal or absent.
- The body should be small relative to the total candle range.
- The candle should indicate an attempt by buyers to push prices upward.
Detailed Explanation
The Inverted Hammer pattern reflects a shift in market behavior within a single candle. Initially, sellers are in control and the market is in a downtrend. During the session, buyers attempt to push prices higher, creating a long upper shadow.
However, sellers still manage to push the price back down before the close, resulting in a small body near the lower end. Despite this, the long upper shadow indicates that buyers are beginning to test higher price levels, which can signal a potential reversal.
The reliability of the pattern increases when:
- The upper shadow is long and clearly visible
- The body is small and positioned near the bottom
- The pattern forms after a strong or extended downtrend
Market Psychology
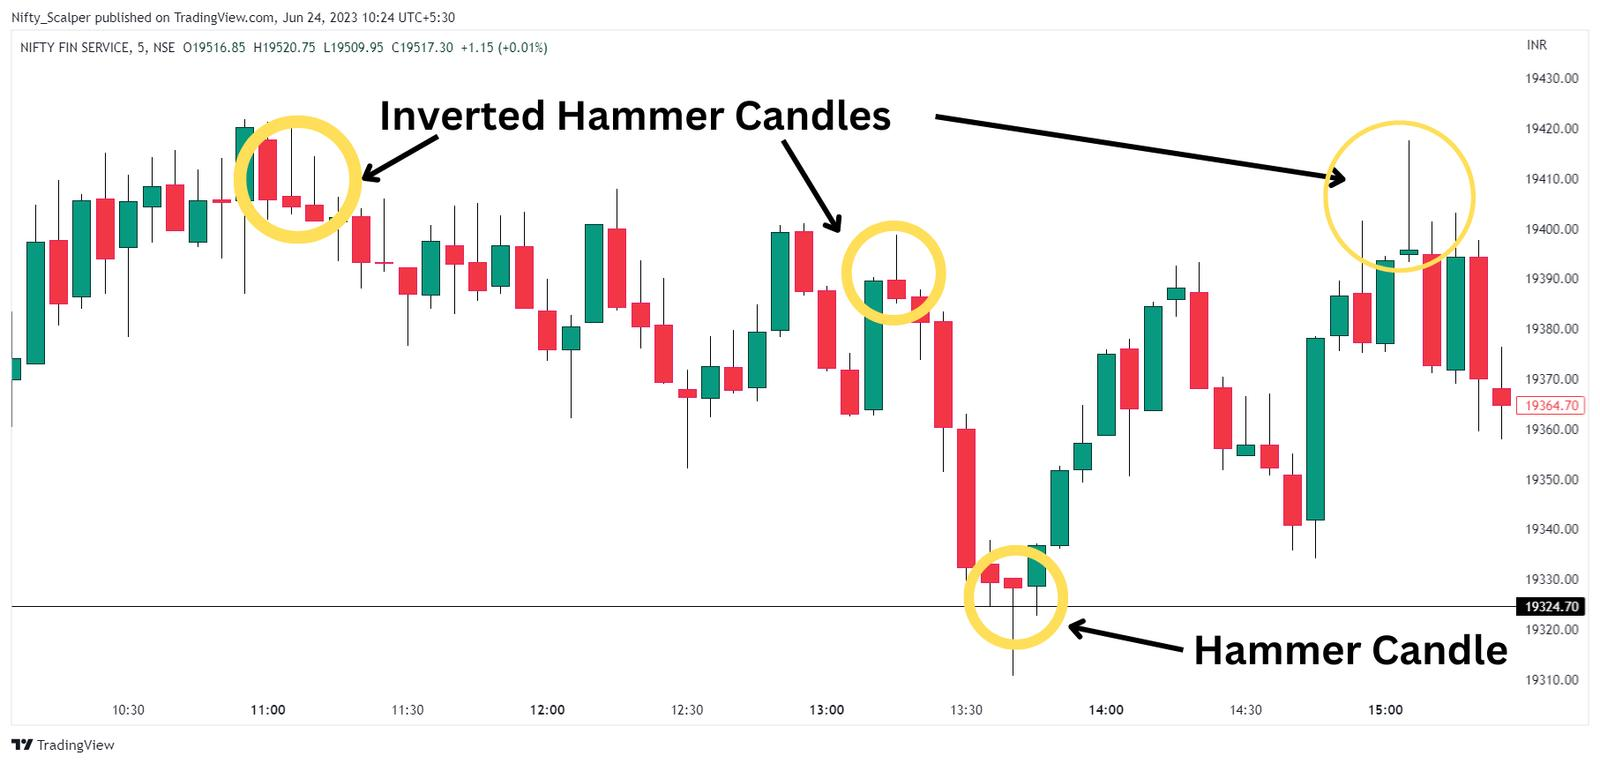
This indicates that the market is testing resistance to the downside, and a reversal may follow if buyers gain strength.
The psychology behind the Inverted Hammer pattern reflects early signs of bullish intent:
- Sellers dominate initially as part of the downtrend.
- Buyers attempt to push prices higher during the session.
- The long upper shadow shows strong buying effort.
- Although sellers push the price back down, bullish pressure is building.
Trade Interpretation
- Entry: Traders typically enter a long position only after confirmation from the next bullish candle.
- Confirmation : A strong bullish candle following the Inverted Hammer confirms the reversal.
- Stop Loss: Usually placed below the low of the Inverted Hammer candle.
- Target: Targets are set based on resistance levels or predefined risk-reward ratios.
Timeframe Relevance (Algo Context)
In a 5-minute timeframe environment:
- The pattern forms in a single candle.
- It becomes active after the candle closes.
- It remains valid for the next 1/2 candles.
- Quick confirmation is important due to short-term nature.
Role of Volume
Volume plays an important role in validating the pattern:
- Higher volume during formation indicates stronger buying interest.
- Lower volume reduces the reliability of the signal.
Using Indicators for Confirmation
To improve reliability, traders combine the Inverted Hammer pattern with technical indicators:
- RSI: Look for oversold conditions and reversal signals.
- MACD: Bullish crossover strengthens confirmation.
- Volume: Increasing volume supports potential reversal.
When to Avoid
- When the pattern forms in sideways or choppy markets.
- When the upper shadow is not significantly long.
- When there is no prior downtrend.
- During high volatility or news-driven conditions
Precautions
- Always confirm the pattern with at least one technical indicator.
- Avoid relying solely on candlestick patterns without context.
- Check overall market trend before making trading decisions.
- Be cautious of false signals in low-volume conditions.
Related Patterns
- Hammer
- Hanging Man
- Bullish Engulfing
- Morning Star
Practical Insights
In real-world trading systems, including algorithm-based detection:
- The pattern is identified using OHLC data and shadow/body relationships.
- Trend validation is used to ensure it forms after a downtrend
- Duplicate signals are avoided within short time intervals
- Signals are marked active or expired based on candle progression
Example Scenario
Consider a stock in a downtrend where, during a candle, buyers push the price significantly higher but fail to maintain those levels, resulting in a long upper shadow. The next candle moves upward and confirms the reversal. This indicates that buyers are gaining strength and a trend reversal may occur.
SUMMARY
- Pattern Type: Bullish Reversal
- Candles Required: 1
- Key Signal: Long upper shadow with small body near bottom
- Best Use Case: After downtrend
- Confirmation Needed: Yes (Next candle + indicators)
- Reliability: Medium to High with confirmation