Evening Star
Bearish Reversal PatternWhat is Evening Star Pattern?
Evening Star is a bearish reversal candlestick pattern that signals a potential shift from an uptrend to a downtrend. It is considered a high-reliability pattern when it appears after a sustained upward move or near a resistance level. The pattern consists of three consecutive candles and reflects a transition from strong buying pressure to increasing selling dominance.
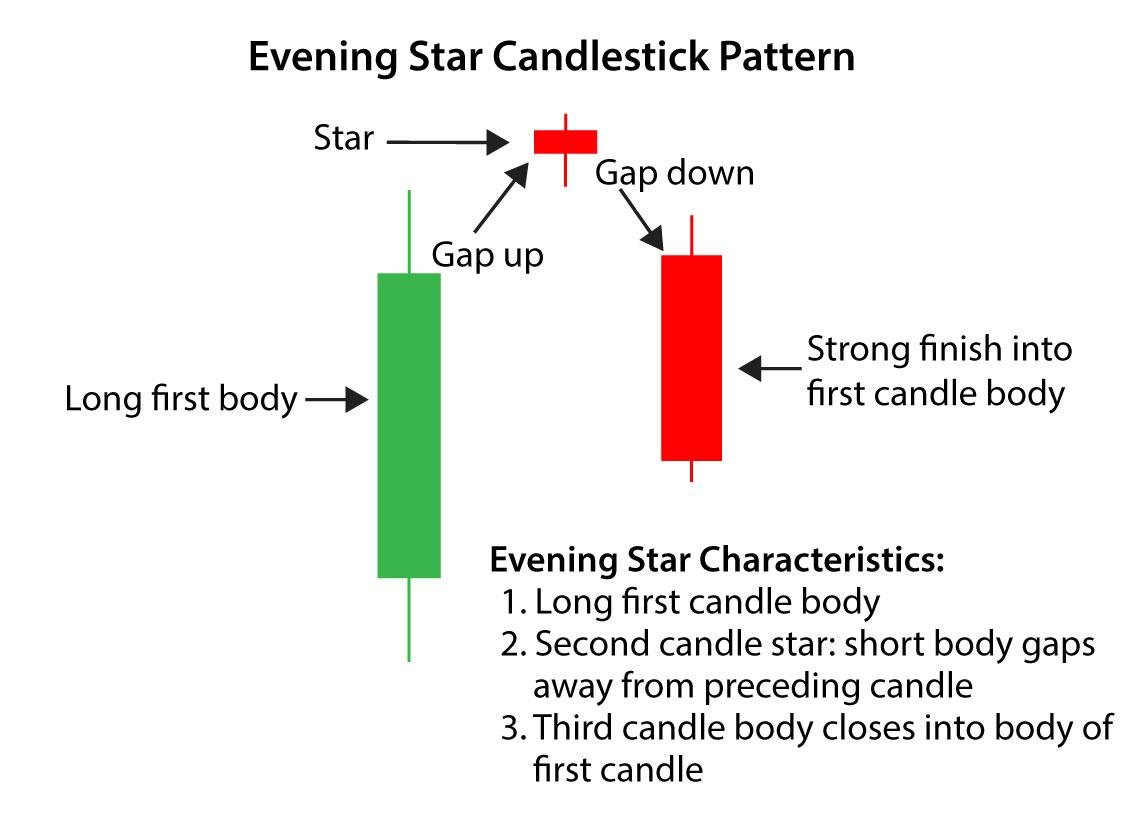
Structure of the Pattern
- The Evening Star pattern consists of three consecutive candlesticks :
- Candle 1: A strong bullish candle that continues the uptrend, reflecting strong buying pressure
- Candle 2: A small-bodied candle (bullish, bearish, or doji) that represents indecision in the market, indicating weakening bullish momentum.
- Candle 3: A strong bearish candle that confirms the reversal, closing below the midpoint of the first candle.
Key Conditions for Formation
- The pattern must form after a clear and sustained uptrend.
- The second candle should have a relatively small body compared to the first candle.
- The third candle must be bearish and show strong downward momentum.
- The closing price of the third candle should be below 50% of the body of the first candle.
- Ideally, the second candle reflects a pause or slowdown in upward movement.
Detailed Explanation
The Evening Star pattern represents a shift in control from buyers to sellers. The first candle shows strong bullish sentiment, where buyers dominate the market. The second candle reflects hesitation, indicating that buyers are losing strength and momentum is slowing.
The third candle is crucial, as it confirms the reversal. A strong bearish close indicates that sellers have stepped in aggressively, overpowering the buyers and potentially initiating a new downward trend.
The reliability of the pattern increases when:
- The first candle = large and strongly bullish
- The second candle = small and shows indecision
- The third candle = large and bearish with strong closing
Market Psychology
This transition from confidence (buying) to fear (selling) is what makes the pattern powerful.
The psychology behind the Evening Star pattern is based on the gradual shift in market sentiment:
- Initially, buyers are in full control, pushing prices higher.
- The second candle reflects hesitation — the market is no longer strongly bullish.
- Sellers begin to enter the market and absorb buying pressure.
- The third candle confirms that sellers have taken over, leading to a reversal.
Trade Interpretation
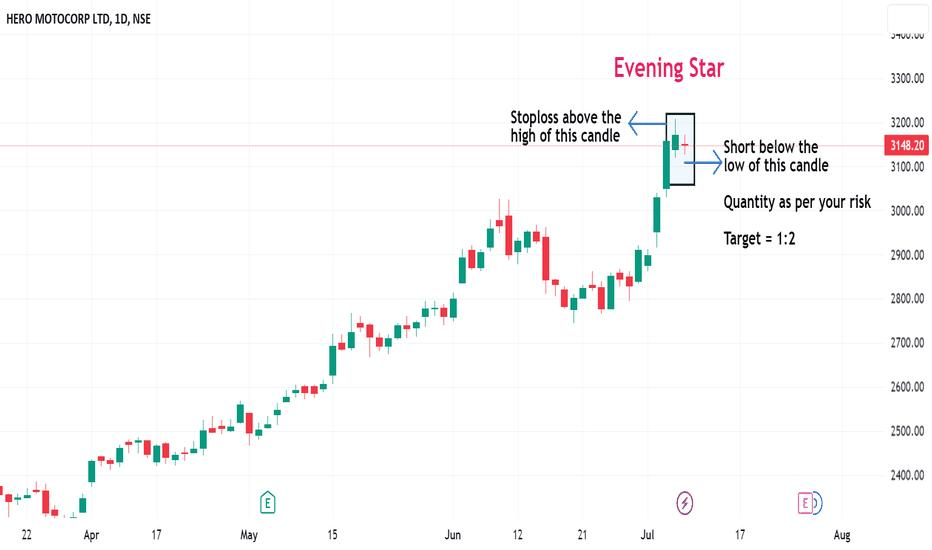
- Entry: Traders often enter a short position after the close of the third bearish candle.
- Confirmation: A close below the midpoint of the first candle acts as confirmation of the reversal.
- Stop Loss: Usually placed above the high of the pattern (often above the second candle).
- Target: Targets are set based on support levels or predefined risk-reward ratios.
Timeframe Relevance (Algo Context)
- In a 5-minute timeframe environment:
- The pattern forms over 3 consecutive candles (15 minutes total).
- It becomes active after the third candle closes.
- It remains valid for the next 1-2 candles.
- Quick confirmation is important due to short-term signal nature.
Role of Volume
Volume plays an important role in validating the pattern:
- Lower volume during the second candle indicates weakening buying pressure.
- Higher volume during the third candle confirms strong selling interest.
Using Indicators for Confirmation
To improve reliability, traders combine the Evening Star pattern with technical indicators:
- RSI: Look for overbought conditions and reversal signals.
- MACD: Bearish crossover strengthens confirmation.
- Volume: Increasing volume on the third candle supports the move.
When to Avoid
- When the pattern forms in sideways or choppy markets.
- When the third candle is weak or does not close below midpoint.
- When there is no clear prior uptrend.
- During highly volatile or news-driven conditions.
Precautions
- Always confirm the pattern with at least one technical indicator.
- Avoid relying solely on candlestick patterns without context.
- Check overall market trend before making trading decisions.
- Be cautious of false signals in low-volume environments.
Related Patterns
- Morning Star (bullish counterpart)
- Bearish Engulfing
- Shooting Star
- Gravestone Doji
Practical Insights
In real-world trading systems, including algorithm-based detection:
- The pattern is identified using OHLC data across three candles.
- Trend validation ensures it forms after an uptrend.
- Duplicate signals are filtered within short intervals.
- Signals are marked active or expired based on candle progression.
Example Scenario
Consider a stock in an uptrend where a strong bullish candle is followed by a small indecision candle. The next candle opens and moves sharply downward, closing below the midpoint of the first candle. This indicates that buyers have lost control and sellers are taking over, creating a potential selling opportunity.
SUMMARY
- Pattern Type: Bearish Reversal
- Candles Required: 3
- Key Signal: Strong bearish close below midpoint of first candle
- Best Use Case: After an uptrend
- Confirmation Needed: Yes (Follow-through selling)
- Reliability: High when conditions are met