Bullish Harami
Bullish Reversal PatternWhat is Bullish Harami Pattern?
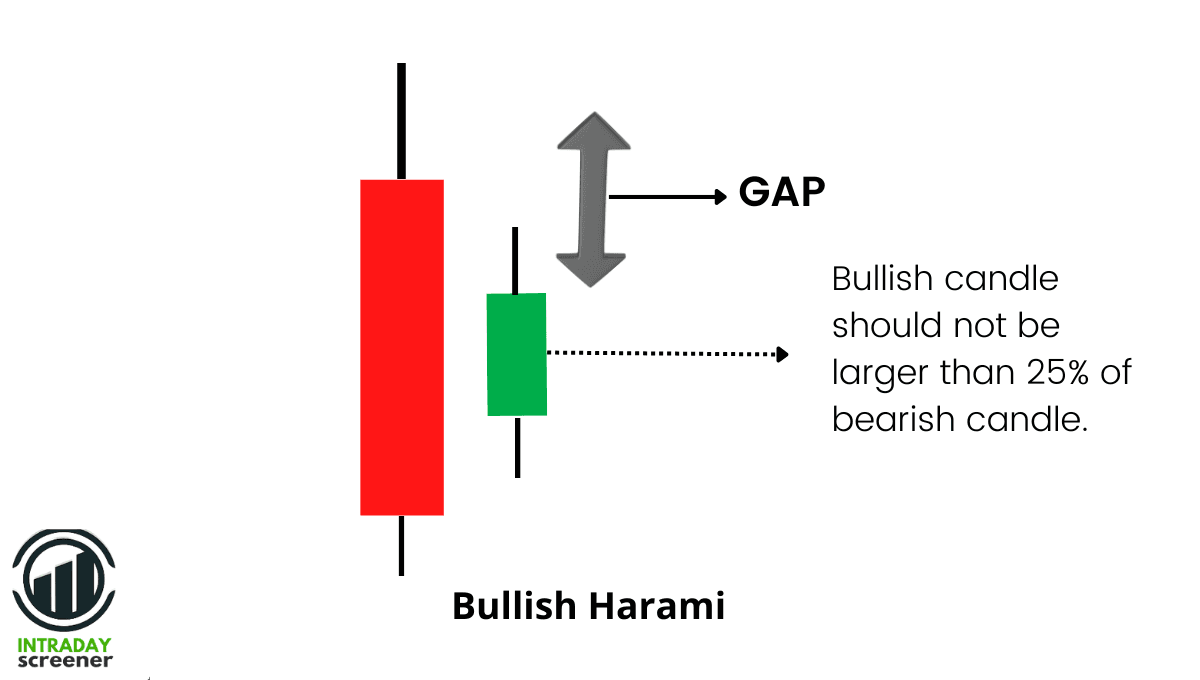
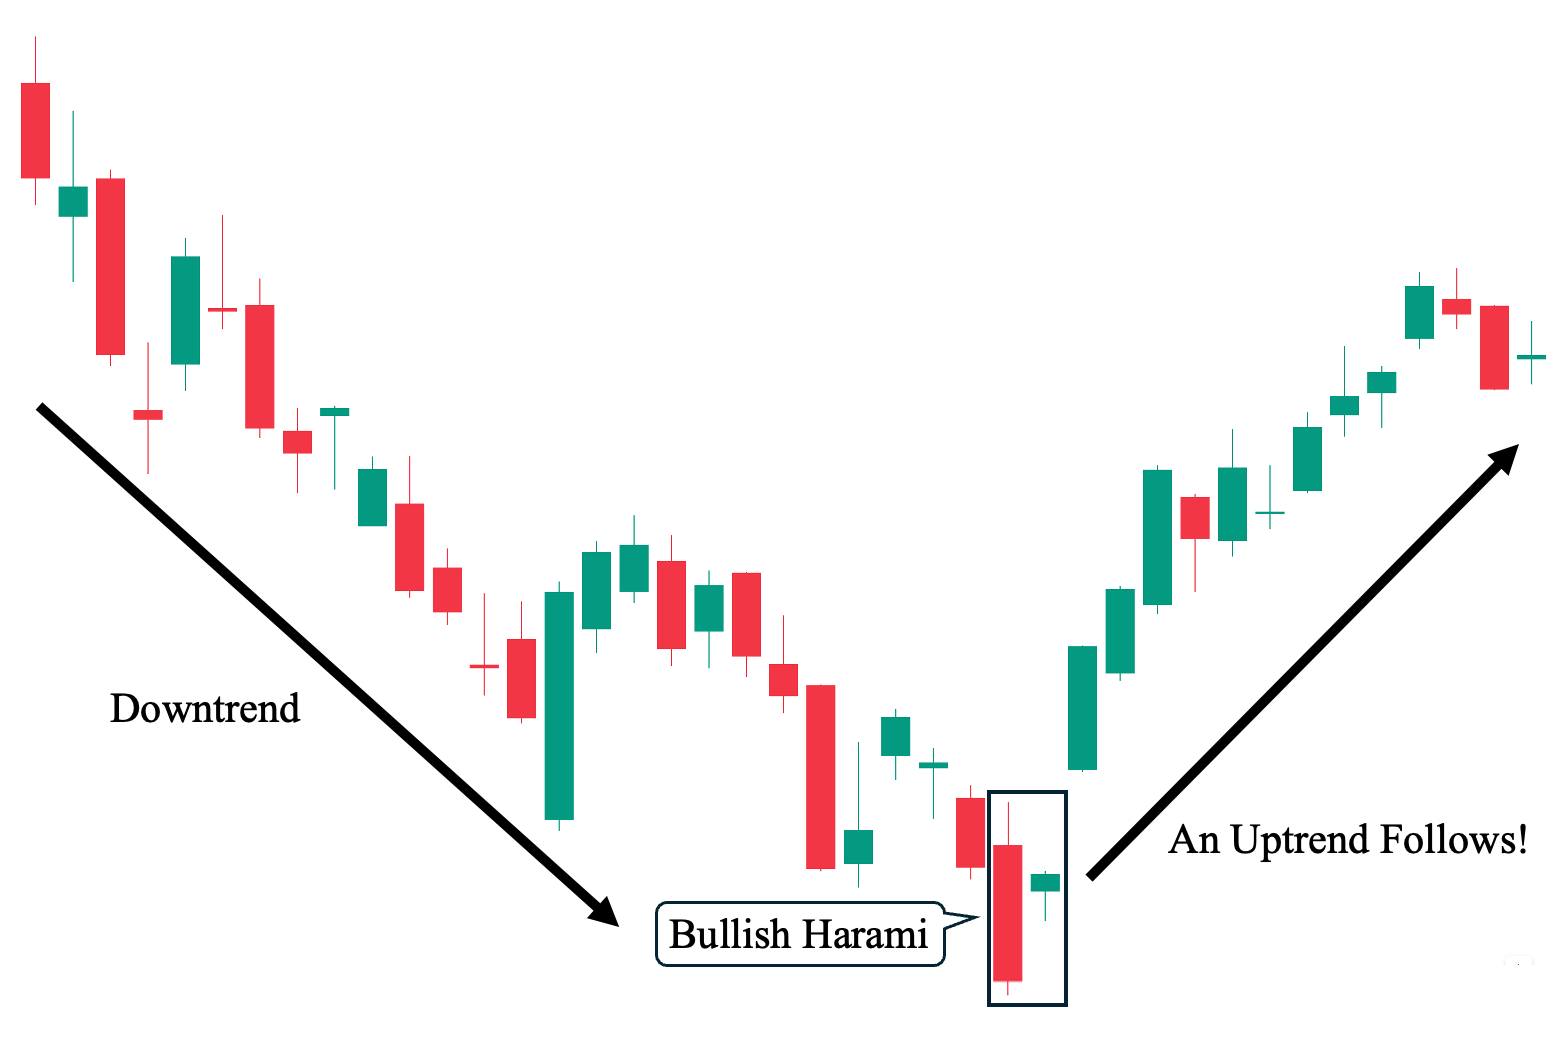
Bullish Harami is a two-candle bullish reversal pattern that appears during a downtrend. The word 'Harami' means 'pregnant' in Japanese, as the second candle (small body) is completely contained within the body of the first candle (large bearish candle). It signals that selling pressure is weakening and a reversal may be near.
Structure of the Pattern
- Two consecutive candlesticks.
- First candle: A long bearish candle (close < open), indicating strong selling.
- Second candle: A small bullish candle (close > open), completely contained within the body of the first candle.
- Containment: Second candle's open > first candle's close, and second candle's close < first candle's open.
Key Conditions for Formation
- Must occur after a clear downtrend.
- First candle must be bearish, second bullish.
- Second candle's body must be fully inside the first candle's body (no touching edges).
- Second candle's body should be relatively small compared to the first.
Detailed Explanation
The Bullish Harami represents a pause in the downtrend. The first large bearish candle shows strong selling momentum. The second small bullish candle opens higher than the previous close and closes lower than the previous open, indicating that sellers could not push prices further down, and buyers are starting to step in.
The containment of the second candle within the first suggests a potential shift in market sentiment from bearish to bullish.
- Strict containment (no touching) ensures the pattern is valid.
- A doji or spinning top as the second candle strengthens the signal.
- Higher volume on the second candle adds confirmation.
Market Psychology
The psychology behind Bullish Harami:
- First candle: Sellers are in full control, driving prices sharply lower.
- Second candle: The bearish momentum slows; buyers step in, pushing the price up, but not enough to exit the first candle's range. This indecision signals a potential reversal.
- The small bullish body shows that buyers are gaining confidence, and the downtrend may be ending.
Trade Interpretation
- Entry: Long (buy) after the close of the second candle, or after a third candle confirming higher prices.
- Confirmation: A bullish close above the high of the first candle or a third consecutive bullish candle.
- Stop Loss: Place below the low of the second candle (or below the first candle's low for more room).
- Target: Previous resistance levels or a risk-reward ratio of 1:2.
Timeframe Relevance (Algo Context)
- In a 5-minute timeframe environment:
- Pattern forms over 2 consecutive candles (10 minutes).
- Signal becomes active after the second candle closes.
- Remains valid for the next 1-2 candles; requires quick confirmation in short timeframes.
Role of Volume
Volume can confirm the pattern:
- Lower volume on the first candle indicates weakening selling.
- Higher volume on the second (bullish) candle shows accumulation.
Using Indicators for Confirmation
Combine with indicators to filter false signals:
- RSI: Oversold (below 30) and turning up.
- MACD: Bullish divergence or histogram turning positive.
- Support: Pattern occurring at a known support level increases reliability.
When to Avoid
- In a strong downtrend without any signs of slowing momentum.
- When the second candle is not fully contained (touches edges).
- If the pattern appears in a sideways or ranging market.
- During low liquidity or after major bearish news.
Precautions
- Wait for confirmation (e.g., a third bullish candle) before entering.
- Use strict containment criteria in algorithmic detection.
- Avoid trading solely on the pattern without trend context.
- Consider the overall market structure and higher timeframe trend.
Related Patterns
- Bearish Harami (bearish counterpart)
- Morning Star
- Hammer
- Bullish Engulfing
Practical Insights
In algorithmic trading:
- Use strict containment: curr['open'] > prev['close'] and curr['close'] < prev['open'].
- Ensure downtrend using a moving average (e.g., price below 20-period MA).
- Filter duplicate signals within a short window.
Example Scenario
A stock in a downtrend: Day 1 opens at ₹100, closes at ₹90 (bearish, body = 10 points). Day 2 opens at ₹92 (higher than previous close), rallies to ₹96, but closes at ₹94. The second candle's body (₹92 to ₹94) is fully inside the first candle's body (₹90 to ₹100). This Bullish Harami suggests selling exhaustion and a possible reversal to the upside.
SUMMARY
- Pattern Type: Bullish Reversal
- Candles Required: 2
- Key Signal: Small bullish candle fully inside the body of a large bearish candle
- Best Use Case: After a downtrend
- Confirmation Needed: Yes (follow-through bullish candle)
- Reliability: Moderate to high with strict containment