Breakaway (Bearish)
Bearish Reversal PatternWhat is Breakaway Pattern?
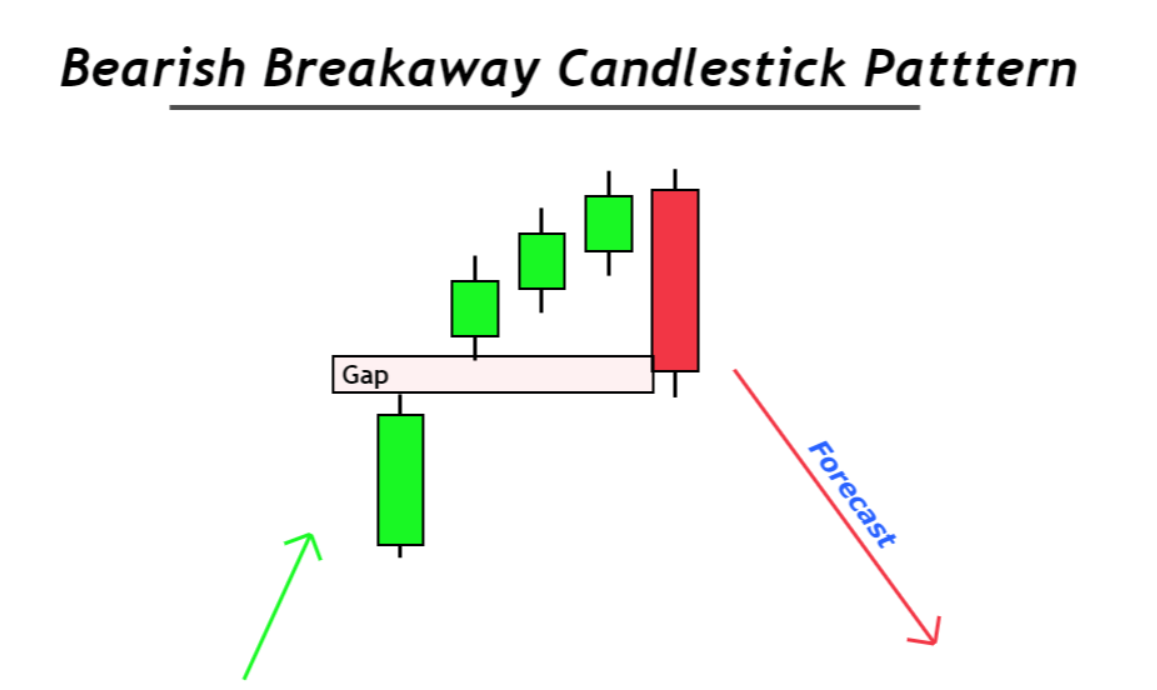
Breakaway (Bearish) is a five-candle reversal pattern that appears after an uptrend. It signals a shift in market sentiment from bullish to bearish, where initial buying strength fades and selling pressure begins to dominate. The pattern typically starts with a gap-up move, followed by weakening bullish candles, and ends with a strong bearish candle confirming the reversal. It is considered more reliable when the final candle closes significantly lower, indicating strong seller control.
Structure of the Pattern
- The pattern consists of five candles:
- Candle 1: A long bullish candle confirming the uptrend.
- Candle 2: A bullish candle that gaps up from the first candle.
- Candle 3: A small bullish or neutral candle showing slowing momentum.
- Candle 4: A small candle indicating weakening buying pressure.
- Candle 5: A strong bearish candle that closes inside or below the gap area.
- The pattern begins with a gap up and ends with a reversal.
Key Conditions for Formation
- The pattern must occur during a clear uptrend.
- There should be a gap up between the first and second candles.
- The middle candles should show weakening bullish momentum.
- The final candle must be strongly bearish.
- The fifth candle should close near or below the gap area.
Detailed Explanation
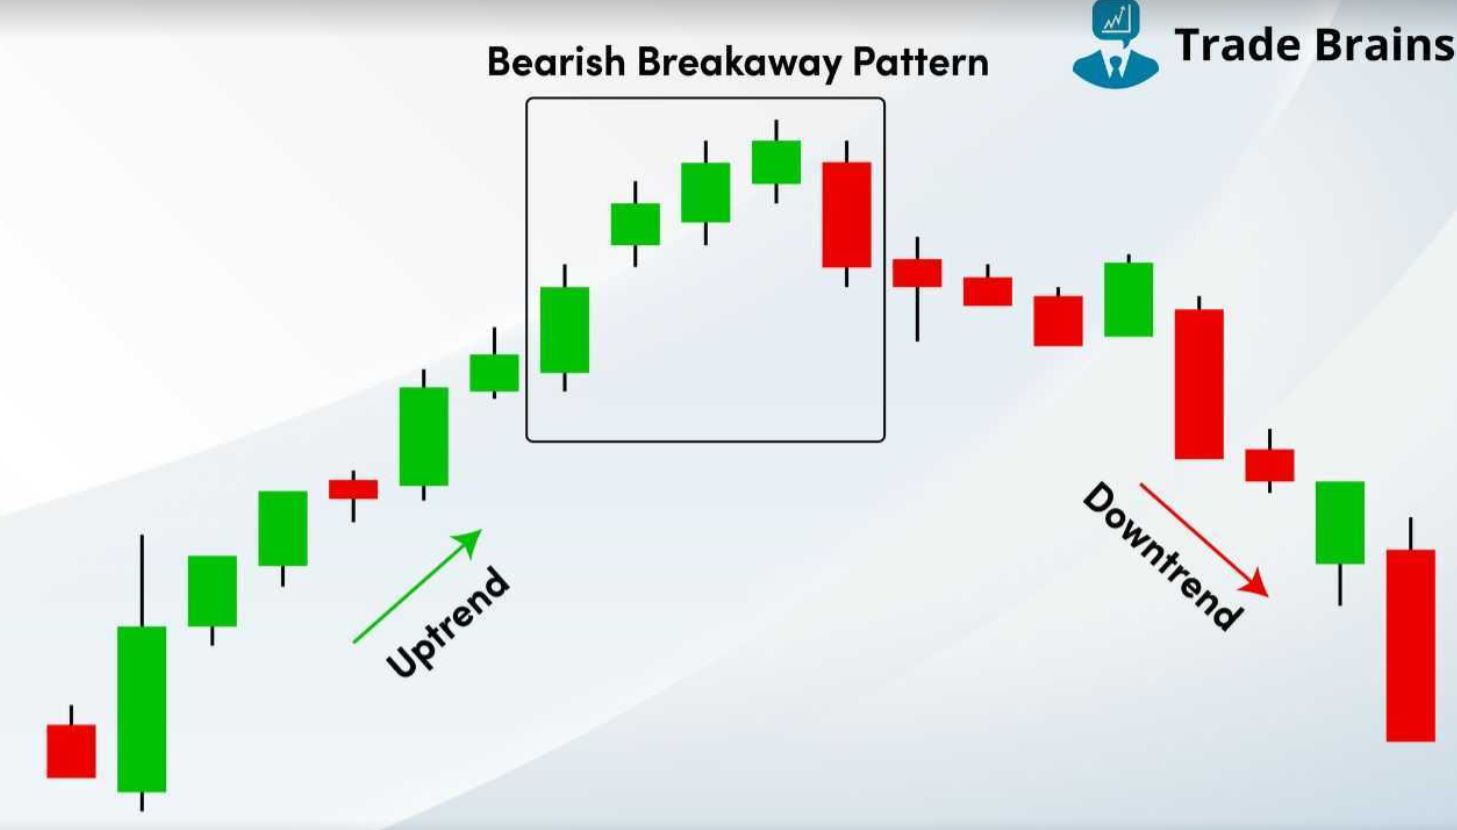
The Breakaway (Bearish) pattern shows a gradual transition from bullish to bearish sentiment. Initially, buyers dominate and push prices higher, creating a gap up.
As the pattern progresses, buying momentum weakens and sellers begin to take control. The final bearish candle confirms the reversal and signals a potential downtrend.
- Initial gap reflects strong bullish sentiment.
- Middle candles indicate weakening buying pressure.
- Final bearish candle confirms reversal.
- Pattern signals trend exhaustion.
Market Psychology
The psychology behind the Breakaway (Bearish) pattern reflects a shift from buyer dominance to seller control.
- Buyers dominate early and push prices higher.
- Momentum slows as buying pressure weakens.
- Sellers gradually enter the market.
- Strong bearish candle confirms shift in control.
Trade Interpretation
- Entry: After the fifth bearish candle closes.
- Confirmation: Strong bearish follow-through.
- Stop Loss: Above the highest point of the pattern.
- Target: Based on support levels or trend continuation.
Timeframe Relevance (Algo Context)
In a 5-minute timeframe environment:
- The pattern forms over 5 candles (25 minutes).
- It becomes active after the fifth candle closes.
- Useful for identifying reversal points.
- Works best in trending markets.
Role of Volume
Volume strengthens pattern reliability:
- High volume during the final bearish candle confirms reversal.
- Decreasing volume during middle candles indicates weakening buyers.
- Volume spike supports selling pressure.
Using Indicators for Confirmation
To improve reliability, traders combine this pattern with indicators:
- RSI: Look for overbought conditions.
- MACD: Bearish crossover strengthens signal.
- Resistance Levels: Pattern near resistance increases reliability.
- Volume: Increased volume confirms reversal.
When to Avoid
- When there is no clear uptrend.
- When the final bearish candle is weak.
- In sideways markets.
- When gaps are not clearly visible.
Precautions
- Wait for confirmation before entering trade.
- Avoid trading without trend validation.
- Use stop loss to manage risk.
- Combine with indicators for better accuracy.
Related Patterns
- Breakaway (Bullish)
- Evening Star
- Three Black Crows
- Bearish Engulfing
Practical Insights
In algorithm-based detection systems:
- Detect gap up between first two candles.
- Track weakening momentum in middle candles.
- Confirm strong bearish reversal candle.
- Validate prior uptrend for accuracy.
Example Scenario
A stock in an uptrend gaps up and continues rising with smaller candles. Eventually, a strong bearish candle appears, reversing the trend and signaling the beginning of a downtrend.
SUMMARY
- Pattern Type: Bearish Reversal
- Candles Required: 5
- Key Signal: Gap up + bearish reversal
- Best Use Case: End of uptrend
- Confirmation Needed: Yes
- Reliability: High