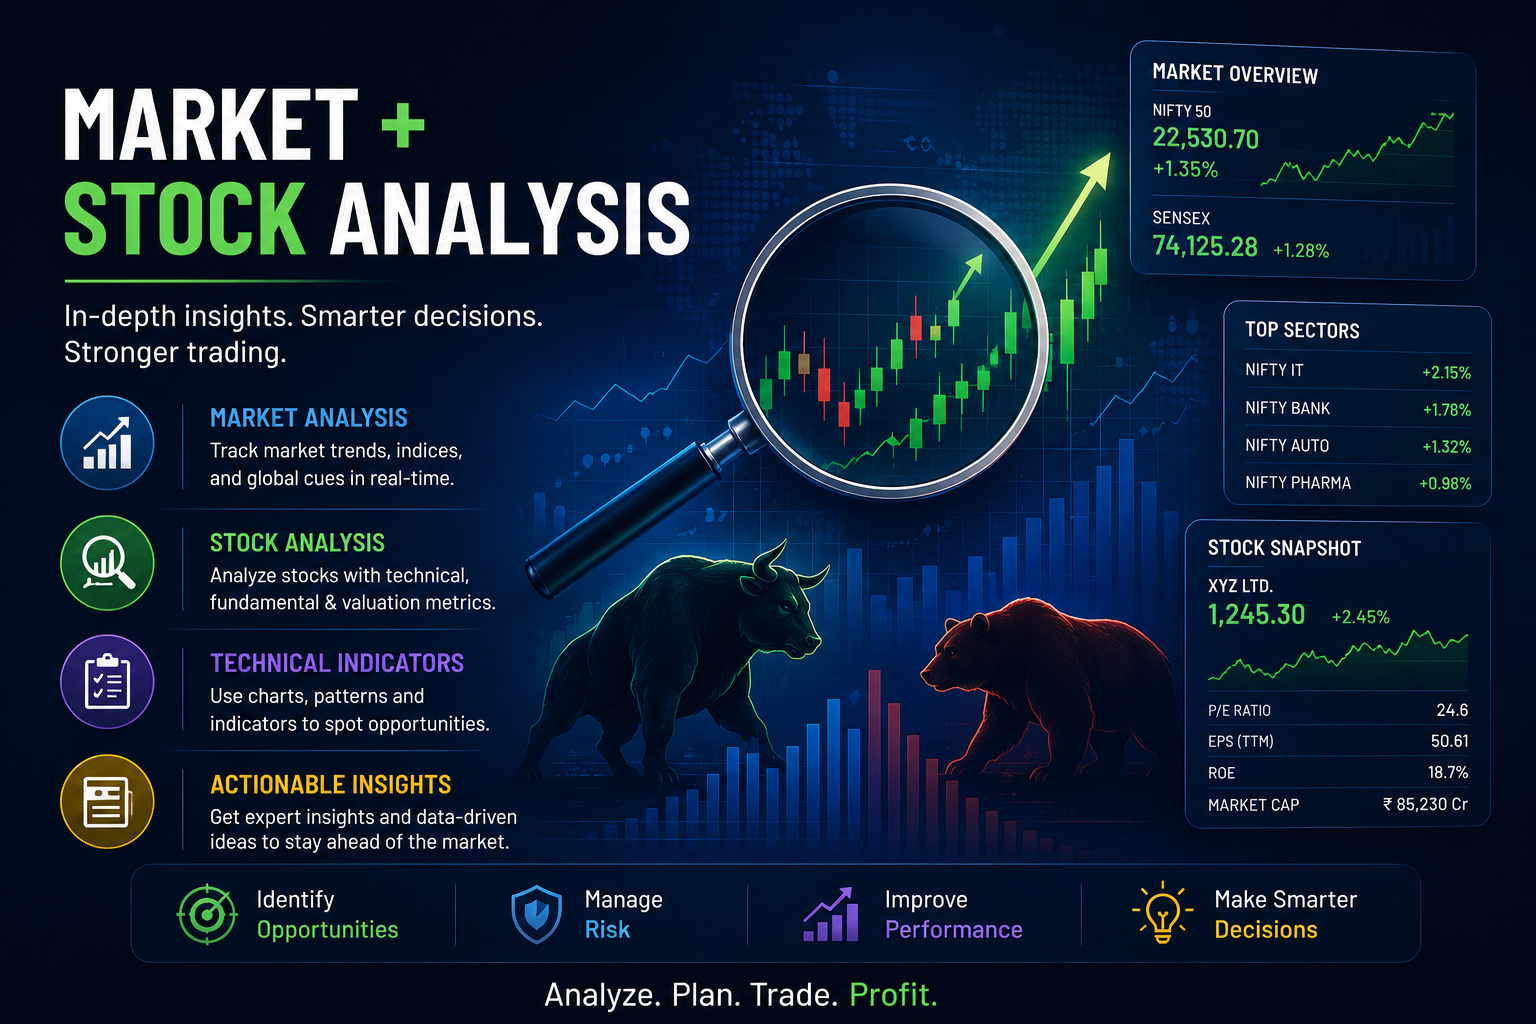
Complete Guide to Market & Stock Analysis using MarketInsights
MarketInsights by AlgoPandas provides powerful tools for market analysis and stock analysis that help traders and investors understand market trends, sector performance, stock fundamentals, technical indicators, and institutional activity from a single dashboard.
Instead of switching between multiple websites and trading platforms, users can access organized market data, technical insights, and stock analytics in one place for faster and smarter decision-making.
What is Market Analysis?
Market analysis helps traders understand overall market sentiment, sector movement, index performance, and trading activity. It allows users to identify whether the market is bullish, bearish, or moving sideways.
MarketInsights provides real-time market dashboards with sector heatmaps, gainers & losers, market breadth, and sector-wise performance tracking to simplify market analysis.
Market Analysis Features
1. Sector Heatmap
Track outperforming and underperforming sectors in real time to identify where market momentum is moving.
2. Top Gainers & Losers
Quickly identify stocks with the highest positive and negative movement during market hours.
3. Market Breadth
Analyze overall market participation using advancing and declining stocks data.
4. Index Performance
Monitor important indices like NIFTY 50 and BANK NIFTY with real-time price and percentage changes.
What is Stock Analysis?
Stock analysis helps investors evaluate the strength, valuation, profitability, technical setup, and overall performance of a company before making investment decisions.
MarketInsights provides advanced stock analysis tools with price summaries, technical indicators, analyst ratings, delivery data, and key financial metrics.
Stock Analysis Features
1. Delivery & Volume Insights
Analyze delivery quantity, traded volume, and delivery percentage to understand market participation and buying interest.
2. Price Summary
View open price, previous close, day high, day low, and current price movement in a simplified format.
3. Analyst Ratings & Forecast
Track analyst recommendations and forecast ratings to understand overall market sentiment for a stock.
4. Technical Price Charts
Analyze stock price movement using multiple chart timeframes including intraday and short-term trends.
5. Stock Scorecard
Evaluate stock performance, valuation, growth, profitability, entry points, and risk factors using simplified scorecards.
6. Key Fundamentals
Access important financial metrics including P/E Ratio, EPS, ROE, Market Cap, Debt/Equity, and Dividend Yield.
Benefits of Market & Stock Analysis for Traders & Investors
- Better understanding of overall market trends
- Identify strong and weak performing sectors
- Analyze stock price movement and momentum
- Make informed trading and investment decisions
- Track technical and fundamental indicators easily
- Discover potential buying and selling opportunities
- Reduce risk with data-driven market analysis
Explore Market & Stock Analysis Tools
Visit marketinsights.algopandas.com to explore real-time market dashboards, stock analysis tools, sector performance tracking, technical indicators, and AI-powered market insights.
Conclusion
Market & stock analysis helps traders and investors understand market trends, sector performance, technical indicators, and stock fundamentals more effectively. With MarketInsights by AlgoPandas, users can access organized market data, technical analysis tools, and AI-powered insights from a single platform to make smarter and faster trading decisions.