How to Read the Order Flow Chart: A Complete Guide to Delta, Imbalance & Volume Profile
Traditional candlestick charts show you how price moved during a particular period. But they do not always show what happened inside the candle.
Order Flow analysis provides a deeper view by showing how buying and selling activity was distributed across different price levels within a candle.
By studying Clusters, Buy Volume, Sell Volume, Delta, Cumulative Delta, Imbalances and Volume Profile, traders can better understand the participation behind a price move.
The goal of Order Flow analysis is not to generate an isolated Buy or Sell signal. Instead, it provides additional context that can help you understand whether aggressive buying or selling is actually producing meaningful price movement.
What Is Order Flow?
Order Flow is a way of analysing executed trading activity at different price levels.
A normal candlestick mainly shows four important values:
- Open
- High
- Low
- Close
Order Flow goes one step deeper by showing the traded volume at individual price levels within the candle.
This allows you to study where buying and selling activity actually occurred instead of looking only at the final candle shape.
The values shown in an Order Flow chart represent executed traded volume, not pending buy or sell orders.
What Does an Order Flow Cluster Show?
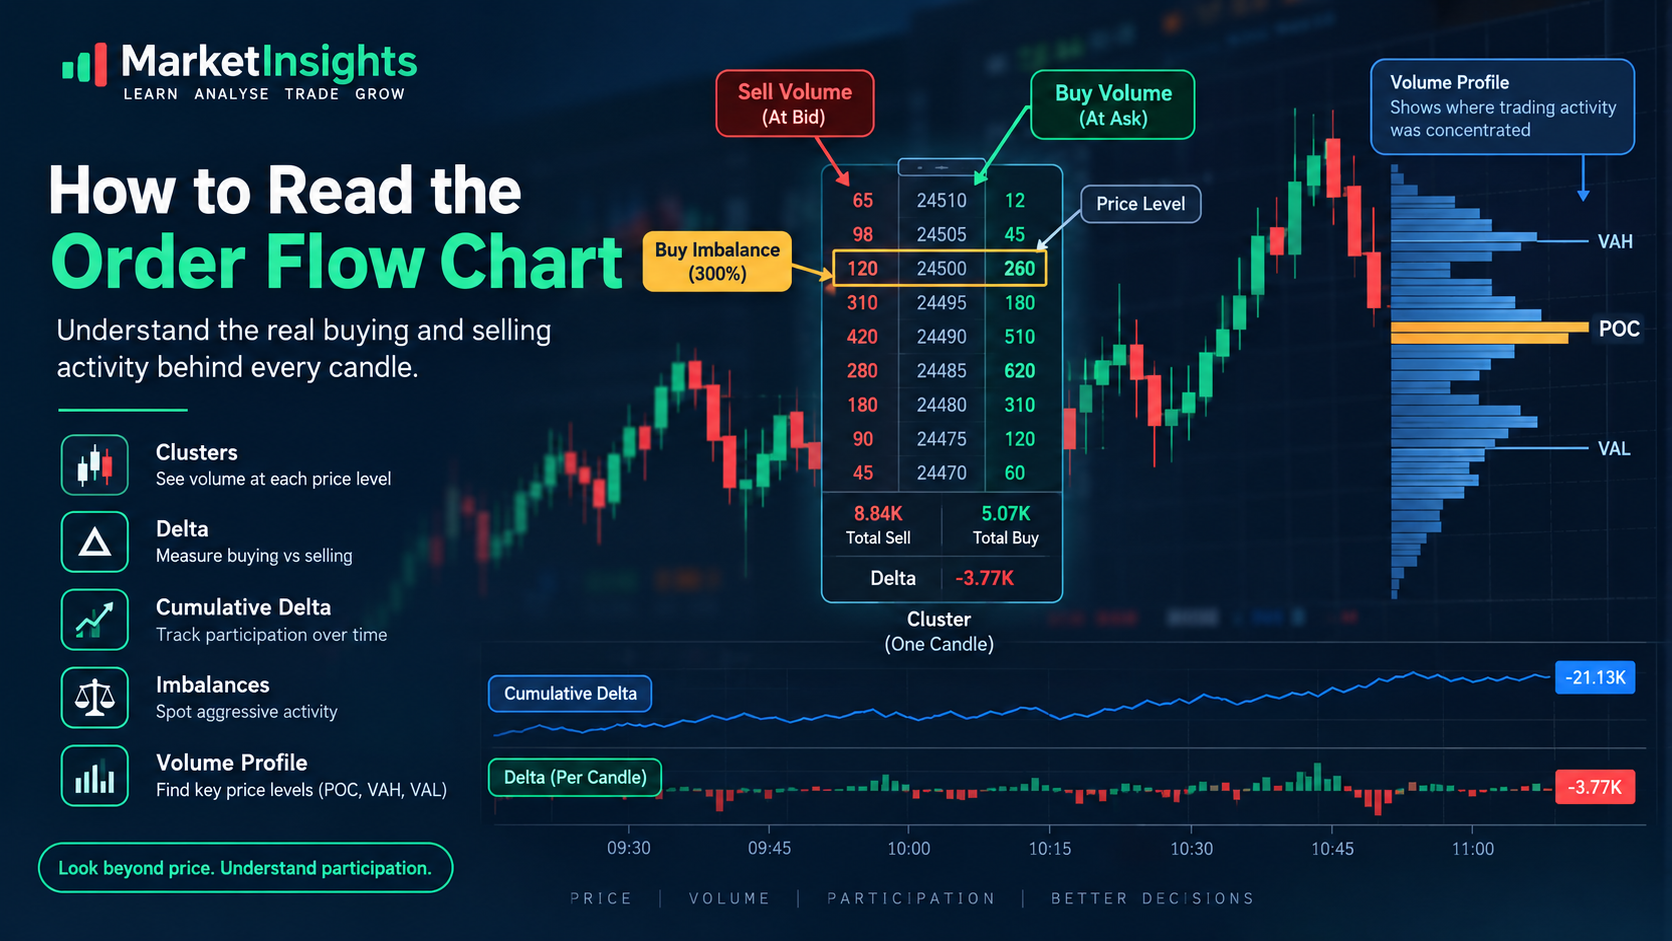
A Cluster provides a detailed view of the trading activity inside a single candle.
Instead of treating the entire candle as one unit, the Cluster breaks it down into individual price levels and displays the volume traded at each level.
Depending on the Order Flow display, you may see separate Buy Volume and Sell Volume values at each price level.
- Sell Volume: Volume executed at the bid by aggressive sellers.
- Buy Volume: Volume executed at the ask by aggressive buyers.
- Total Sell: Total sell-side traded volume within the Cluster.
- Total Buy: Total buy-side traded volume within the Cluster.
- Delta: Difference between Buy Volume and Sell Volume.
- Cumulative Delta: Running total of Delta across multiple Clusters or candles.
This information helps you understand not only where price traded, but also the type of participation occurring at those prices.
Buy Volume and Sell Volume
One of the first things to understand when reading a Cluster is the difference between Buy Volume and Sell Volume.
Buy Volume
Buy Volume generally represents aggressive buying activity where buyers execute trades at the ask.
Higher Buy Volume indicates greater aggressive buying participation at that price level.
Sell Volume
Sell Volume generally represents aggressive selling activity where sellers execute trades at the bid.
Higher Sell Volume indicates greater aggressive selling participation at that price level.
However, high buying or selling volume should not automatically be interpreted as bullish or bearish. The most important question is how price responds to that activity.
What Is Delta in Order Flow?
Delta measures the difference between Buy Volume and Sell Volume within a candle or Cluster.
The basic formula is:
Delta = Buy Volume − Sell Volume
- Positive Delta: Buy Volume is higher than Sell Volume.
- Negative Delta: Sell Volume is higher than Buy Volume.
- Delta near zero: Buy and Sell Volume are relatively balanced.
Delta provides useful information about aggressive participation, but it should always be interpreted together with price movement.
Why Positive Delta Does Not Always Mean Bullish Price Action
A common mistake is to assume that positive Delta automatically means price should move higher.
For example, suppose a candle has strong positive Delta, meaning aggressive buyers are active, but the candle makes very little upward progress.
This tells us that buying activity is present, but the buying is not producing a proportional price response.
Similarly, strong negative Delta does not automatically guarantee that price will continue lower.
The important relationship is:
Aggressive Activity + Price Response
Instead of asking only whether buyers or sellers were more aggressive, ask whether that aggression was actually able to move price.
How to Read Cumulative Delta
Cumulative Delta keeps a running total of Delta across multiple candles.
While Delta tells you about the buy-versus-sell difference for a particular candle, Cumulative Delta helps you understand how that difference has developed over a broader period.
For example, if successive candles continue to produce positive Delta, Cumulative Delta will generally move higher.
If negative Delta dominates, Cumulative Delta will generally move lower.
Price and Cumulative Delta Relationship
One useful approach is to compare the direction of price with the direction of Cumulative Delta.
- Price rising + Cumulative Delta rising: Buying participation is broadly supporting the price movement.
- Price falling + Cumulative Delta falling: Selling participation is broadly supporting the downward movement.
- Price making new highs + Cumulative Delta weakening: Participation may be changing.
- Price making new lows + Cumulative Delta improving: Selling participation may be losing strength.
A divergence between price and Cumulative Delta does not guarantee a reversal.
Instead, it indicates that participation is no longer behaving in the same way as price and therefore deserves additional attention.
What Are Order Flow Imbalances?
An Imbalance identifies a price level where one side of the market is significantly more aggressive than the other.
The comparison is made diagonally between Sell Volume at one price and Buy Volume at the adjacent price.
The purpose of an imbalance is to highlight areas where buying or selling activity is considerably stronger than the opposing activity.
How Does the Imbalance Ratio Work?
The Imbalance Ratio determines how much stronger one side needs to be before it is highlighted as an imbalance.
For example, if the Imbalance Ratio is set to 300%, one side needs to have at least three times the volume of the opposing side.
Suppose the comparison is:
- Sell Volume = 65
- Buy Volume = 260
Because 260 is four times 65, the Buy Volume satisfies a 300% imbalance threshold.
This identifies a price level where buying was considerably stronger than the corresponding opposing activity.
What Are Stacked Imbalances?
Sometimes imbalances appear across several consecutive price levels.
When multiple imbalances occur together, they can provide a stronger indication that aggressive activity was concentrated across a price area rather than appearing at only one isolated level.
These areas can be useful when studying how price behaves around important support, resistance, breakout or reaction zones.
However, an imbalance should still be interpreted in the context of price action and the broader market structure.
What Is Volume Profile?
Volume Profile shows how trading activity was distributed across a price range.
Instead of showing volume primarily against time, Volume Profile shows volume according to price levels.
Longer profile bars indicate prices where more volume was traded, while shorter bars indicate areas where relatively less volume was traded.
This helps identify prices where market participation was concentrated.
Important Volume Profile Levels
POC – Point of Control
POC is the price level where the highest amount of volume was traded within the selected profile range.
It can help identify an important area of market activity.
VAH – Value Area High
VAH represents the upper boundary of the Value Area.
VAL – Value Area Low
VAL represents the lower boundary of the Value Area.
Value Area
The Value Area contains a selected percentage of total traded volume.
A commonly used setting is 70%.
Volume Profile can therefore help identify an important price area first, after which Order Flow can be used to study how buyers and sellers behave when price reaches that area.
Order Flow and Support & Resistance
Order Flow becomes especially useful when it is combined with an existing price level or trading setup.
For example, you may first identify:
- Support
- Resistance
- Breakout levels
- Volume Profile levels
- High Volume Nodes
- Important price zones
Once price reaches that area, Order Flow can provide additional information about the participation occurring there.
This approach is generally more useful than attempting to trade every individual imbalance or Delta reading in isolation.
How to Analyse an Order Flow Setup
A practical way to read Order Flow is to follow a structured sequence.
Location → Participation → Price Response → Confirmation
Step 1: Identify the Location
Start with a price area that already matters to your analysis.
This could be a support zone, resistance level, breakout area, Volume Profile level or High Volume Node.
The location provides the context in which the Order Flow activity should be interpreted.
Step 2: Check Participation
Next, examine the Order Flow data.
Look at:
- Buy Volume
- Sell Volume
- Delta
- Imbalances
- Stacked Imbalances
- Areas of heavier volume
This helps you understand whether buyers or sellers are becoming more aggressive.
Step 3: Observe the Price Response
After identifying aggressive activity, check whether price is actually responding to it.
This is one of the most important parts of Order Flow analysis.
Strong aggressive buying with strong upward price movement tells a different story from strong aggressive buying where price barely moves.
Step 4: Look for Absorption or Exhaustion
Order Flow can also help identify situations where aggressive market activity does not produce the expected price movement.
For example, strong buying activity followed by limited upward price progress can indicate that aggressive buying is being met by opposing activity.
Similarly, heavy selling without meaningful downward progress can indicate that selling pressure is being absorbed.
These observations should be treated as contextual information rather than guaranteed reversal signals.
Order Flow Reading Example
Suppose price reaches a resistance area that has already been identified using your technical analysis.
You then examine the Order Flow Cluster and observe significant Buy Volume at several price levels.
The next step is not simply to conclude that price must break resistance.
Instead, ask:
- Is Buy Volume significantly higher than Sell Volume?
- Is Delta positive?
- Are there buy imbalances?
- Are imbalances appearing across multiple price levels?
- Is price actually progressing higher?
- Is Cumulative Delta also increasing?
- Is the price response consistent with the aggressive buying?
If aggressive buying continues and price makes meaningful upward progress through resistance, the Order Flow data is supporting the price movement.
If aggressive buying is very high but price struggles to move higher, the situation requires more attention because participation and price response are not behaving in the same way.
Understanding Price and Order Flow Together
The most important principle of Order Flow analysis is that volume should be interpreted together with price.
Consider two different situations.
Strong Buying + Strong Price Progress
When aggressive buying is accompanied by meaningful upward price movement, buyers are demonstrating the ability to move price.
This provides stronger confirmation of the current price movement than positive Delta alone.
Strong Buying + Limited Price Progress
When aggressive buying is high but price barely moves, the market is showing a different behaviour.
The aggressive buyers are active, but their activity is not producing proportional upward progress.
This can be a useful clue for identifying potential absorption or a change in market participation.
Order Flow vs Traditional Candlestick Charts
Traditional candlesticks and Order Flow serve different purposes.
| Traditional Candlestick | Order Flow |
|---|---|
| Shows Open, High, Low and Close | Shows traded activity at price levels |
| Shows overall candle direction | Shows Buy and Sell Volume distribution |
| Provides price structure | Provides participation details |
| Useful for identifying trends and patterns | Useful for studying aggressive buying and selling |
| Does not show detailed volume distribution by price | Shows volume distribution within the candle |
Order Flow does not replace the candlestick chart. Instead, it can be used as an additional layer of information.
How to Combine Order Flow with Volume Profile
A useful workflow is to combine the broader context from Volume Profile with the detailed information provided by Order Flow.
First, use Volume Profile to identify important price areas such as POC, VAH, VAL and high-volume areas.
Then observe what happens when price reaches those areas.
Order Flow can help answer questions such as:
- Are buyers becoming aggressive?
- Are sellers becoming aggressive?
- Is there a significant imbalance?
- Is volume concentrated at a particular price?
- Is aggressive activity actually moving price?
This combination provides both a broader price-volume context and a more detailed view of participation.
Common Mistakes When Reading Order Flow
1. Treating Positive Delta as an Automatic Buy Signal
Positive Delta means Buy Volume is greater than Sell Volume. It does not guarantee that price will continue higher.
2. Treating Negative Delta as an Automatic Sell Signal
Negative Delta indicates greater Sell Volume, but price may still stabilize or reverse depending on the surrounding context.
3. Ignoring Price Response
Order Flow data should always be compared with what price is actually doing.
4. Trading Every Imbalance
An imbalance highlights aggressive activity at a price level. It should not automatically be treated as an entry signal.
5. Ignoring Market Location
The same Order Flow reading can have a different meaning depending on whether it occurs near support, resistance, a breakout area or another important price zone.
6. Using One Metric in Isolation
Delta, Cumulative Delta, Imbalance and Volume Profile each provide different information.
Combining them with price action generally provides better context than relying on a single reading.
A Simple Order Flow Checklist
Before interpreting an Order Flow setup, you can use the following checklist:
- Identify the important price location.
- Check Buy Volume and Sell Volume.
- Check Delta.
- Look for significant Imbalances.
- Check for Stacked Imbalances.
- Compare Cumulative Delta with price.
- Check Volume Profile levels such as POC, VAH and VAL.
- Observe whether aggressive activity is actually moving price.
- Look for possible absorption or exhaustion.
- Use the complete context rather than one isolated signal.
Key Takeaways
Order Flow provides a more detailed view of what happens inside a price candle.
- Clusters show traded volume at individual price levels.
- Buy Volume represents aggressive buying activity.
- Sell Volume represents aggressive selling activity.
- Delta measures the difference between Buy Volume and Sell Volume.
- Cumulative Delta tracks Delta across multiple candles.
- Imbalances highlight areas where one side is significantly more aggressive.
- Stacked Imbalances can highlight concentrated aggressive activity across multiple price levels.
- Volume Profile shows where trading activity was concentrated across price.
- POC identifies the price with the highest traded volume in the selected profile.
- VAH and VAL define the upper and lower boundaries of the Value Area.
The most important principle is to compare participation with price response.
Conclusion
Order Flow analysis helps traders look beyond the traditional Open, High, Low and Close of a candle.
By examining Clusters, Buy Volume, Sell Volume, Delta, Cumulative Delta, Imbalances and Volume Profile, you can develop a clearer understanding of the participation behind price movements.
However, Order Flow works best when it is used as an additional layer of analysis rather than as an isolated Buy or Sell system.
A practical approach is:
Location → Participation → Price Response → Confirmation
Start with an important price area, study the buying and selling activity occurring there, and then observe whether that activity is actually producing meaningful price movement.
This approach can help you better understand market participation and identify situations involving aggressive buying, aggressive selling, imbalances, absorption, exhaustion and changes in participation.
Important Note
Order Flow analysis is an analytical framework and should not be treated as a guaranteed trading signal. Market conditions can change rapidly, and no indicator, volume analysis method or trading framework can guarantee future performance. This content is for informational purposes only and does not constitute investment advice. Always conduct your own research and risk assessment before making investment decisions.