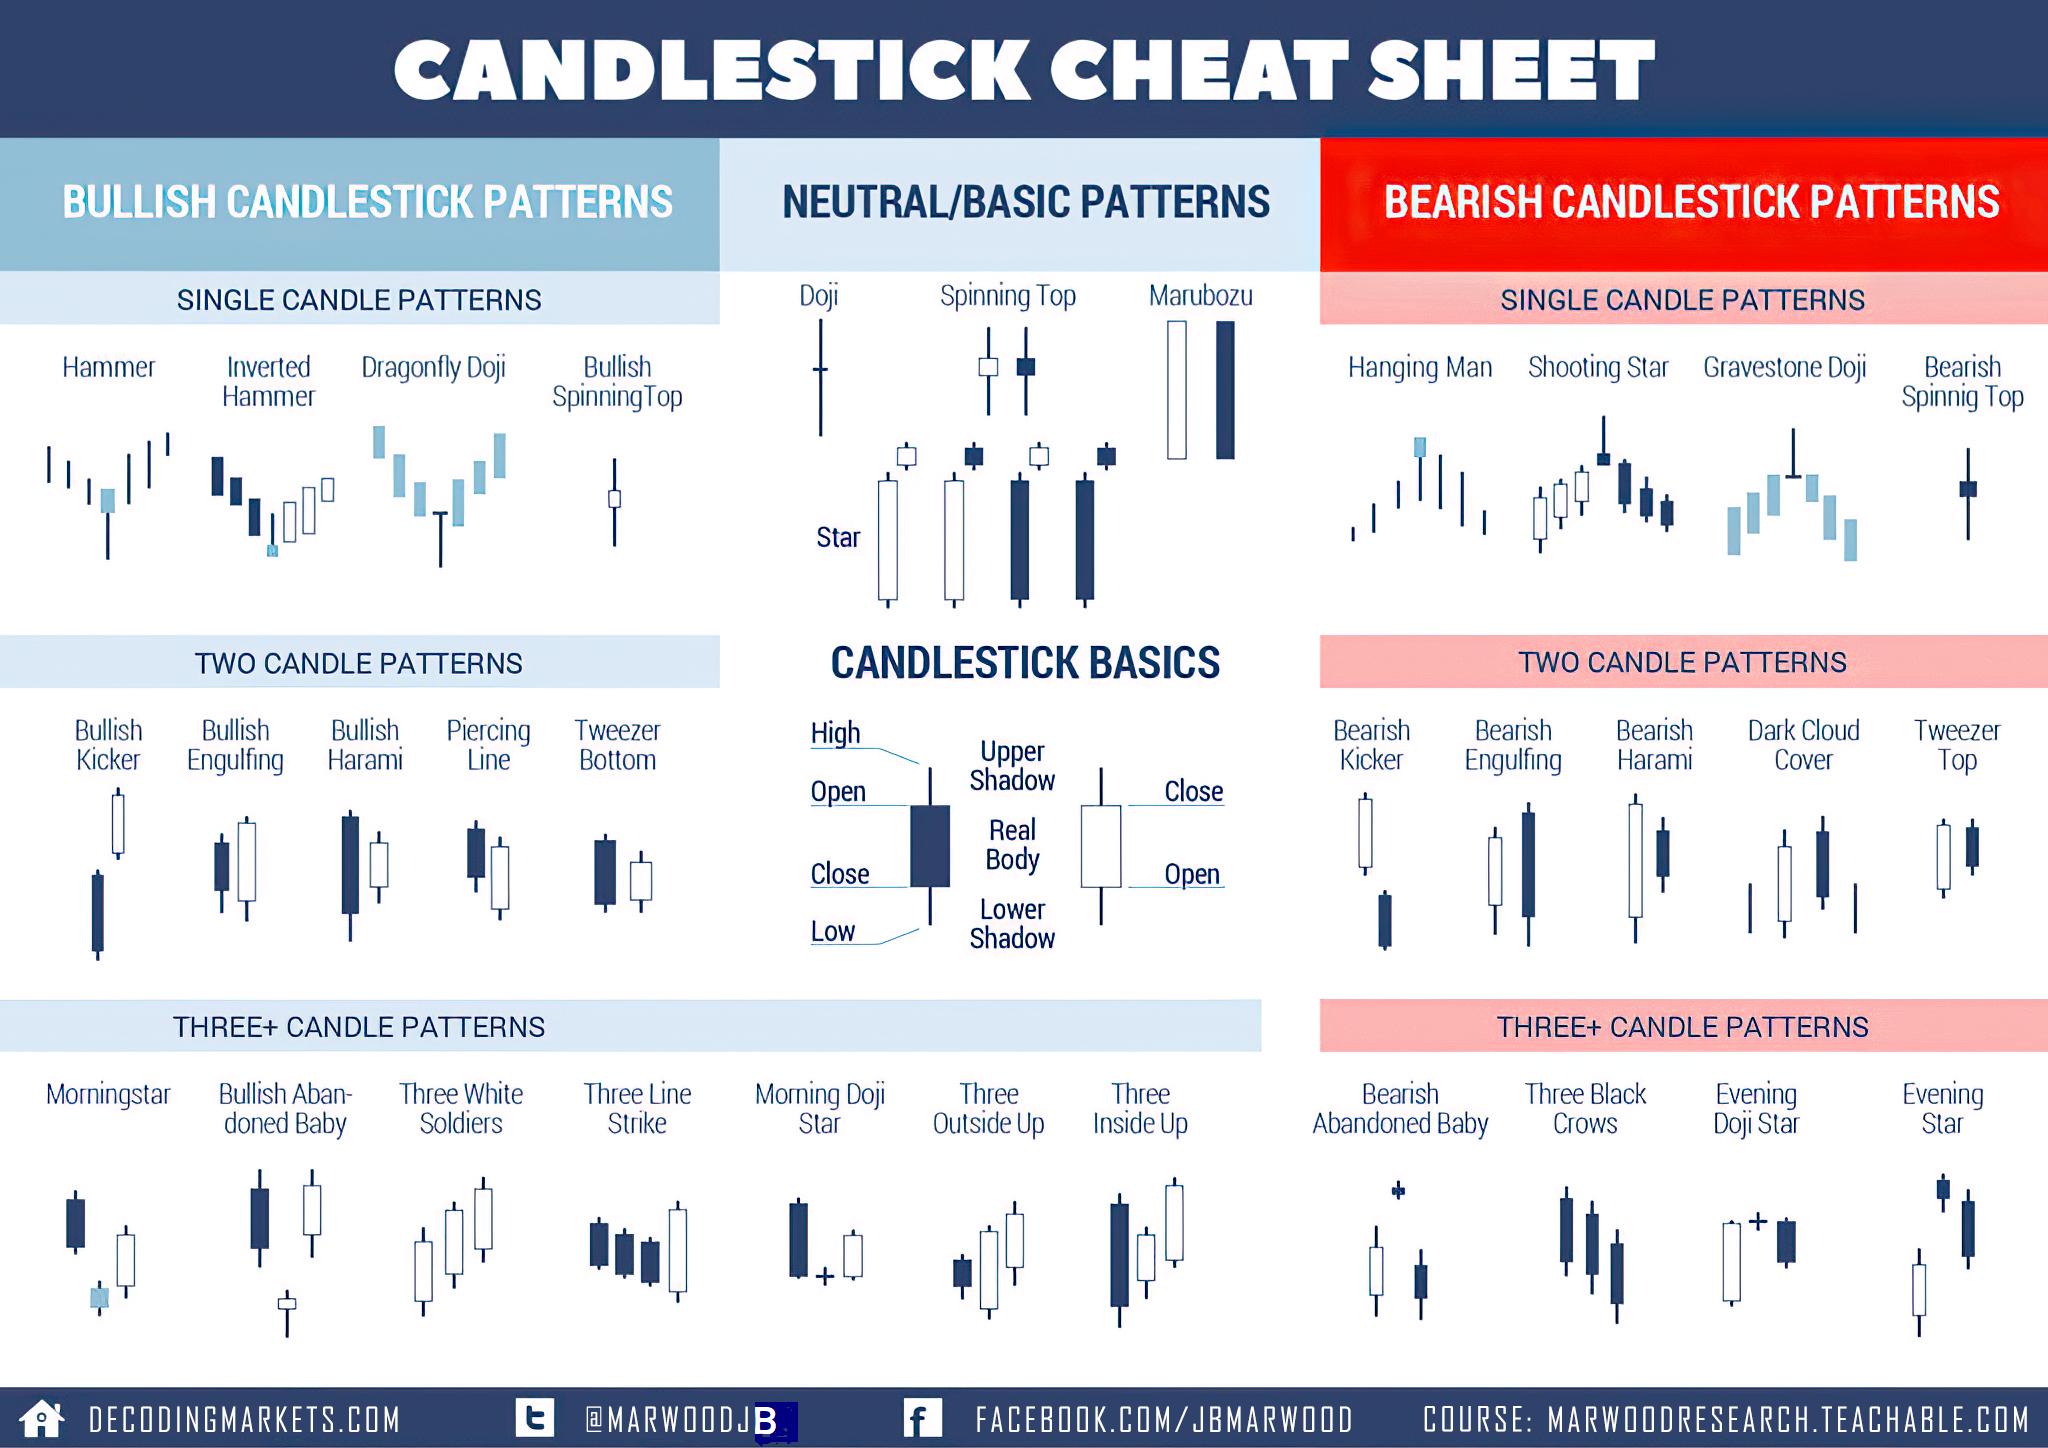
How to Read Candlestick Patterns
Candlestick patterns help traders understand market sentiment by showing the battle between buyers and sellers. Each candle represents price movement within a specific time frame and gives clues about potential reversals or continuation.
🟢 1. Bullish Patterns
- Hammer: Forms after a downtrend and signals potential reversal. It shows buyers stepping in strongly.
- Bullish Engulfing: A large green candle completely engulfs the previous red candle, indicating strong buying momentum.
Tip: Bullish patterns work best when they appear near support levels.
🔴 2. Bearish Patterns
- Shooting Star: Appears after an uptrend and indicates rejection of higher prices.
- Bearish Engulfing: A strong red candle engulfs the previous green candle, showing selling pressure.
Tip: Bearish patterns are more reliable near resistance zones.
📊 3. Doji
A Doji candle forms when opening and closing prices are almost equal, showing indecision between buyers and sellers.
Types: Standard Doji, Long-Legged Doji, Dragonfly Doji, Gravestone Doji
Insight: Doji alone is not a signal—wait for confirmation from the next candle.
📍 4. Use with Levels
Candlestick patterns become powerful when combined with support and resistance levels.
- At support → Look for bullish patterns
- At resistance → Look for bearish patterns
Pro Tip: Patterns in the middle of a range are less reliable.
⚡ 5. Confirmation is Key
Never trade based on a single candle. Always wait for confirmation from the next candle or volume.
- Break of high/low of pattern candle
- Strong follow-through candle
⚠️ Common Mistakes
- Trading every pattern without context
- Ignoring trend direction
- Not waiting for confirmation
- Overcomplicating with too many patterns
⭐ Final Tip
Candlestick patterns are powerful, but they are not magic. Combine them with trend, levels, and proper risk management. The key is patience and consistency—not prediction.