Find Market Trends Faster with Candlestick Pattern Screening
Candlestick patterns are one of the most widely used tools in technical analysis. Traders use these patterns to understand market psychology, identify trend reversals, and discover possible trading opportunities.
The Candlestick Pattern Screener by AlgoPandas is designed to simplify this process by automatically identifying bullish and bearish candlestick patterns in real time. Instead of manually scanning multiple charts, traders can quickly explore patterns and market signals from a single dashboard.
What is the Candlestick Pattern Screener?
The Candlestick Pattern Screener is a smart technical analysis tool available on the AlgoPandas platform. It helps traders identify important candlestick formations that may indicate potential market movement.
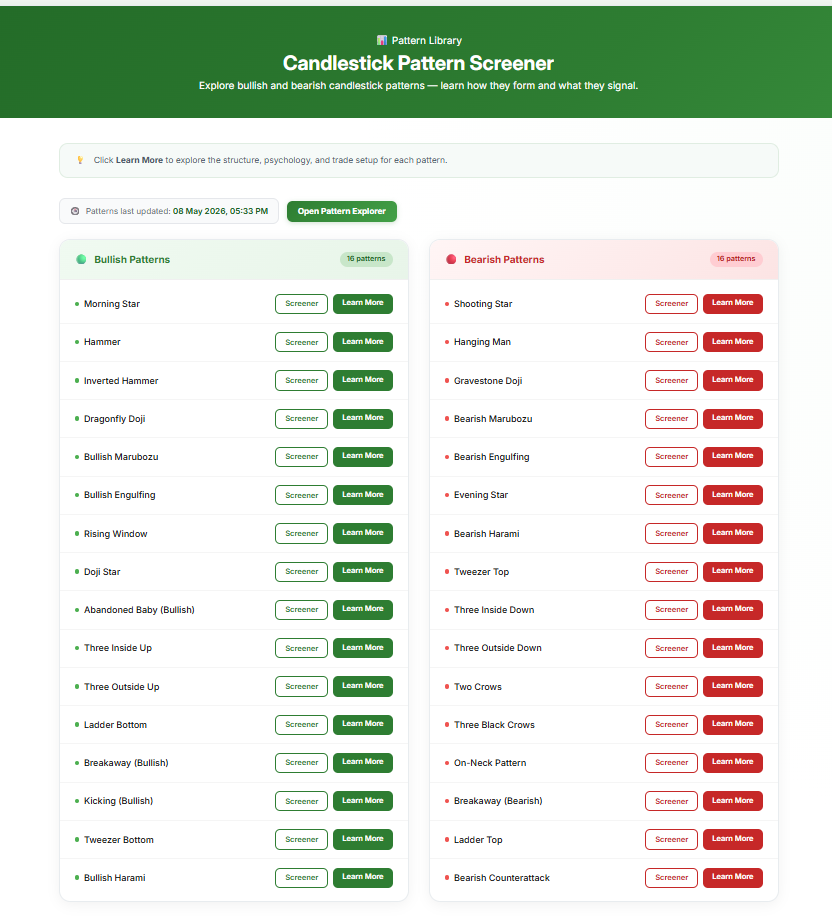
The platform categorizes patterns into bullish and bearish sections, making it easier for users to analyze market direction and trading opportunities.
Bullish Candlestick Patterns
Bullish patterns generally indicate possible upward price movement or buying momentum in the market.
The screener helps users identify bullish patterns such as: Morning Star , Hammer , Dragonfly Doji, Doji Star , and many more.
These patterns can help traders identify potential reversal zones and buying opportunities.
Bearish Candlestick Patterns
Bearish patterns often indicate selling pressure or possible downward movement in stock prices.
The screener detects patterns such as: Shooting Star , Hanging Man, Evening Star, Tweezer Top , and many more.
These signals help traders identify weak market momentum and possible bearish reversals.
Features of the Pattern Screener
- Automatic candlestick pattern detection
- Separate bullish and bearish categorization
- Easy-to-use interface
- Pattern Explorer integration
- Learn More section for pattern education
- Fast stock screening process
- Real-time market scanning
How Traders Can Use This Tool
Traders can use the screener to quickly identify stocks forming important technical patterns. Instead of manually checking charts one by one, the platform automatically scans and displays matching stocks and patterns.
Users can:
- Select a candlestick pattern
- Open the screener for matching stocks
- Analyze trend confirmation
- Study support and resistance levels
- Plan entry and exit strategies
AI and Technical Analysis
Modern trading platforms are increasingly using AI and automation to improve technical analysis. The AlgoPandas screener simplifies pattern recognition and reduces manual effort by organizing technical signals into a structured and easy-to-understand system.
This helps traders save time and focus more on decision-making and strategy building.
Conclusion
The Candlestick Pattern Screener by AlgoPandas is a powerful tool for traders who want to simplify technical analysis and discover trading opportunities faster. By automatically identifying bullish and bearish patterns, the platform helps users analyze market trends more efficiently and make smarter trading decisions.