Top 5 Indicators Every Intraday Trader Must Know
Indicators help traders understand market trends, momentum, volatility, and precise entry/exit points. In intraday trading, where decisions must be made quickly, these indicators act as a guide to avoid emotional trading and improve accuracy.
📈 1. Moving Averages
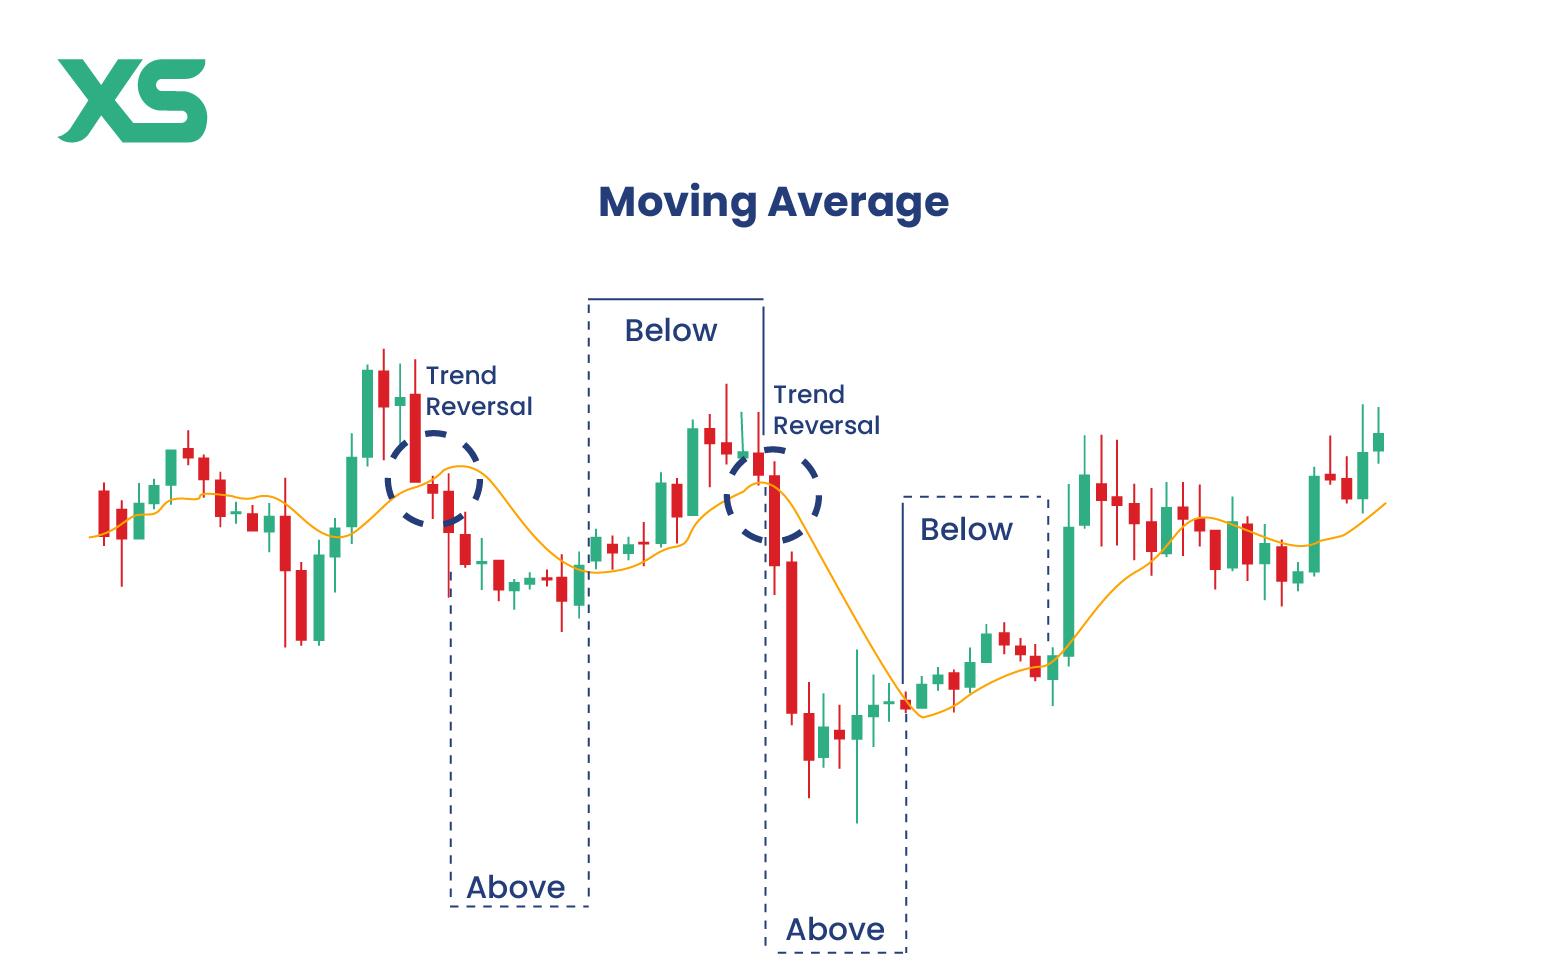
Moving averages help identify the overall trend direction by smoothing price data. The most commonly used are EMA (Exponential Moving Average) and SMA (Simple Moving Average).
How to use: If price is above the moving average, the trend is bullish. If below, the trend is bearish. Traders often use 9 EMA and 21 EMA crossovers for quick intraday signals.
Pro Tip: Moving averages also act as dynamic support and resistance levels.
📊 2. RSI (Relative Strength Index)
RSI is a momentum indicator that measures the speed and strength of price movement on a scale from 0 to 100.
Key levels: Above 70 indicates overbought conditions, and below 30 indicates oversold conditions.
How to use: Traders look for reversals when RSI enters extreme zones or use the 50 level to confirm trend strength.
Pro Tip: RSI divergence (price moving opposite to RSI) can signal early trend reversals.
📉 3. MACD
MACD (Moving Average Convergence Divergence) is a combination of trend and momentum indicator. It consists of the MACD line, signal line, and histogram.
How to use: When the MACD line crosses above the signal line, it indicates a bullish signal. A cross below indicates a bearish signal.
Additional insight: The histogram shows momentum strength—bigger bars mean stronger momentum.
Pro Tip: Use MACD along with trend indicators to reduce false signals.
📍 4. VWAP
VWAP (Volume Weighted Average Price) shows the average price of a stock throughout the day based on both price and volume. It is widely used by institutional traders.
How to use: If price is above VWAP, the market is considered bullish. If below, it is bearish.
Best use: Works perfectly for intraday trading as it resets every day.
Pro Tip: VWAP acts as a strong support/resistance and often attracts price during sideways markets.
🔔 5. Volume
Volume represents the number of shares traded and is one of the most important indicators for confirming price movements.
How to use: A breakout with high volume indicates strong conviction, while low volume breakouts are often unreliable.
Key insight: Sudden spikes in volume can signal big moves or reversals.
Pro Tip: Always combine volume with price action for better accuracy.
⭐ Final Tip
Don’t use too many indicators at once—it creates confusion and slows decision-making. Focus on 2–3 indicators, understand them deeply, and combine them with proper risk management for consistent intraday trading.