How to Use Our Multi-Agent System for Stock Analysis
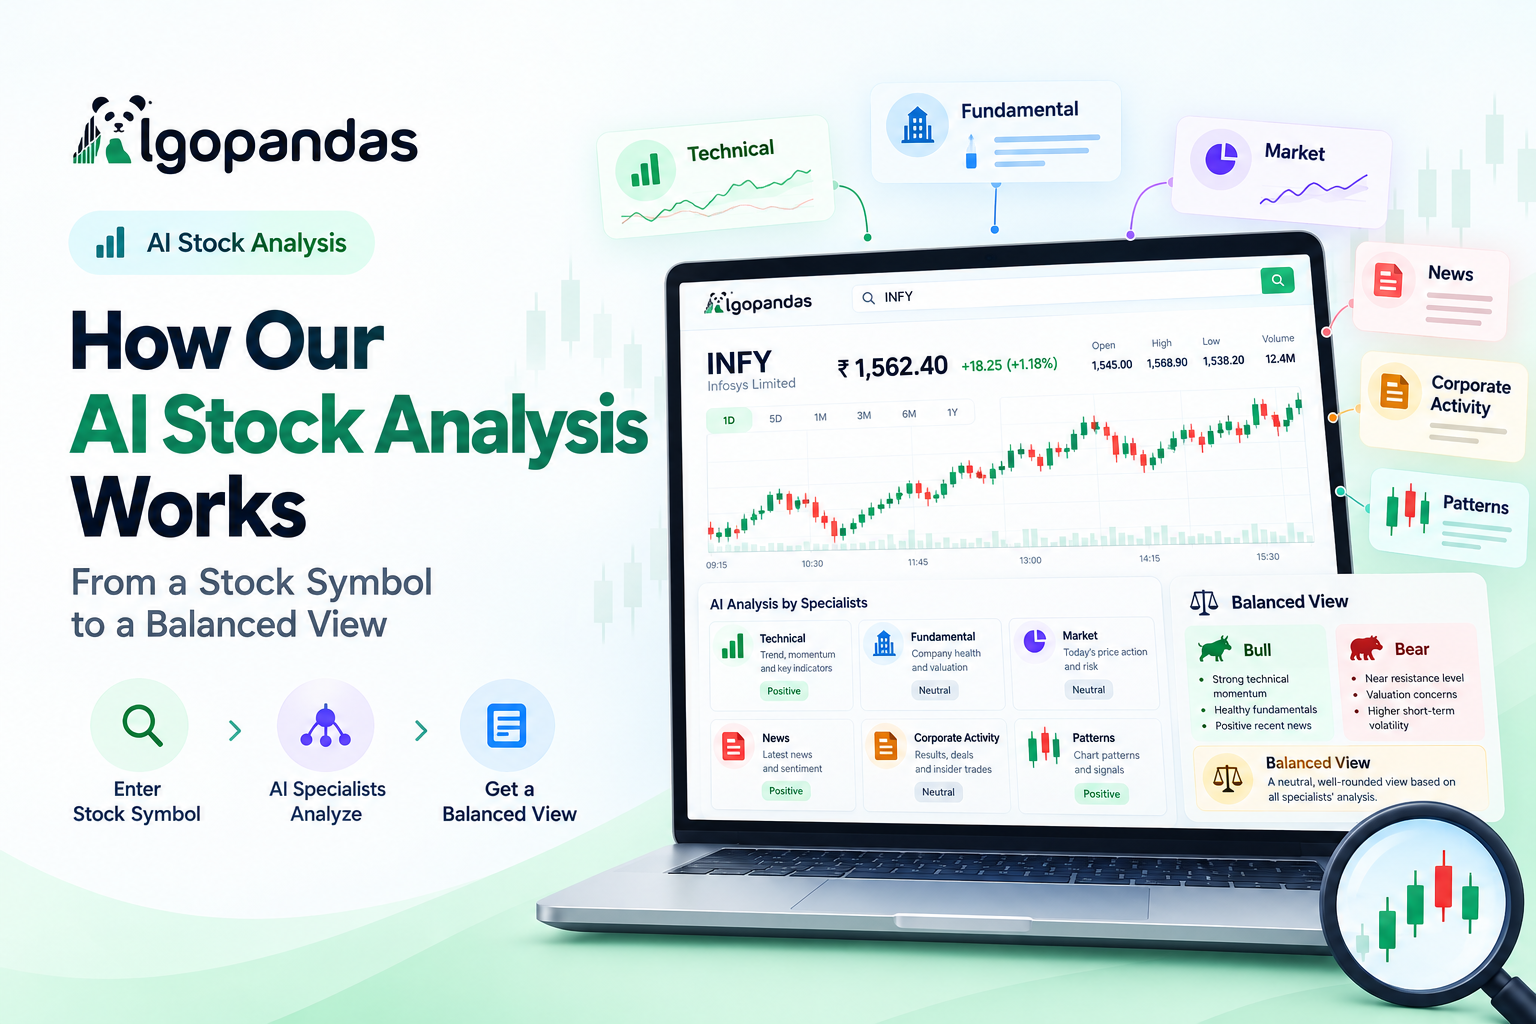
Want to understand a stock's current market position without manually checking multiple sources? Our AI-Powered Multi-Agent Stock Analysis System brings together market data, company fundamentals, technical indicators, recent news, corporate activities, and candlestick patterns to help you understand a stock from multiple perspectives.
Simply enter a stock symbol, such as INFY (Infosys), to generate a comprehensive report with easy-to-understand explanations and a balanced market outlook.
The system is designed to help you understand market conditions and make more informed decisions. It provides analysis for educational purposes and does not recommend buying or selling any stock.
How to Generate a Stock Analysis Report
Follow these simple steps to generate your own report.
Step 1: Select a Stock
Open the AI Analysis module on our platform and enter the stock symbol you want to analyze.
For example:
- INFY — Infosys
- RELIANCE — Reliance Industries
- TCS — Tata Consultancy Services
Step 2: Generate the Report
Submit the stock symbol to generate its analysis report.
The system collects the available market and company information and processes it through multiple specialized analysis components. Each component examines a different aspect of the stock, and the findings are combined into a single report.
Step 3: Review the Analysis
Once the report is generated, explore the different sections to understand the stock's current position, financial health, market conditions, and potential risks.
Step 4: Explore the Balanced View
You can also explore the Balanced View, which presents both bullish and bearish perspectives on the stock.
This optional analysis examines the strongest arguments on both sides and combines them into an overall assessment based on the available evidence.
The Balanced View loads separately from the main report, allowing you to start reviewing the analysis while it is being prepared.
What Data Does Our System Analyze?
Our multi-agent system combines several categories of information to provide a broader understanding of a stock.
1. Price and Market Data
The system examines the stock's latest available price and daily market activity, including:
- Latest price and previous closing price
- Opening, high, and low prices
- Price change and percentage change
- Trading volume
- Delivery quantity and delivery percentage, when available
This information helps you understand how the stock is performing during the trading session.
2. Technical Analysis
The system evaluates price charts and technical indicators to understand the stock's trend, momentum, and volatility.
The analysis includes:
- Moving averages such as EMA 9 and EMA 21
- RSI and MACD indicators
- Bollinger Bands
- Average True Range (ATR)
- Volume Weighted Average Price (VWAP)
It uses available historical daily candles and intraday five-minute candles to assess market conditions. The report also identifies the timeframe used for the technical analysis.
3. Fundamental Analysis
Technical indicators show what is happening in the market, but company fundamentals help explain the financial position of the business.
Our system examines available financial information, including:
- Earnings Per Share (EPS)
- Price-to-Earnings ratio (P/E)
- Return on Equity (ROE)
- Debt-to-equity ratio
- Market capitalization
- Dividend yield
These metrics help you understand the company's profitability, financial health, borrowing levels, and valuation.
4. News and Corporate Activities
Company news and corporate events can provide additional context for understanding a stock.
The system processes available company-related news and corporate information, including:
- Recent company announcements
- Dividends, bonus shares, stock splits, rights issues, and buybacks
- Insider trades reported by promoters and company insiders
- Bulk deals and block deals
Relevant news is summarized into short, readable points. Corporate activities are presented with available dates and details.
The report also indicates when relevant information is unavailable or may be outdated.
5. Candlestick Pattern Analysis
Candlestick patterns can provide additional context about recent price movements.
The system identifies available patterns, such as:
- Bullish and bearish engulfing patterns
- Shooting stars
- Morning stars and evening stars
The report explains detected patterns in simple language so that users can understand what the chart formation represents.
Pattern detection depends on the availability and freshness of the underlying pattern data.
Understanding Your Analysis Report
The report combines the collected information into several sections, each serving a different purpose.
| Report Section | What You Can Learn |
|---|---|
| Price Analysis | The latest available price and the stock's daily performance |
| Fundamental Analysis | The company's financial position and key financial metrics |
| Technical Analysis | The stock's trend, momentum, and technical indicator readings |
| Risk Analysis | Volatility and potential areas of concern |
| News Analysis | Recent news related to the company |
| Corporate Activity | Relevant announcements, corporate actions, and reported trades |
| Pattern Analysis | Detected candlestick patterns and their explanations |
| AI Explanation | A plain-English summary of the overall findings |
| Balanced View | Bullish and bearish arguments, key conflicts, and an overall outlook |
| Data Quality | Information about missing data, freshness, and report completeness |
Together, these sections provide a broader picture than examining a single indicator or data source.
What Is the Balanced View?
Stock analysis can be misleading when it considers only positive or negative evidence.
Our Bull vs. Bear Balanced View addresses this by examining both sides of the available evidence.
It includes three perspectives:
Bullish Perspective: Highlights the strongest evidence supporting a positive outlook while acknowledging the most important facts against that view.
Bearish Perspective: Highlights the strongest evidence supporting a cautious outlook while acknowledging the most important facts against that view.
Research Manager: Evaluates both perspectives and produces a balanced assessment based on the quality of the evidence.
The resulting report includes:
- Overall outlook: Positive, Mixed, or Cautious
- Confidence level: Low, Medium, or High
- Strongest bullish and bearish arguments
- Important conflicts between the available signals
- Key factors to monitor
- Missing information that may affect the assessment
The confidence level reflects the system's assessment of the available evidence; it is not a probability that the analysis will be correct.
How Does the System Handle Missing Information?
Reliable analysis requires more than presenting numbers. It also requires identifying when information is incomplete.
Our system includes data-quality checks to help prevent misleading interpretations.
- Missing data: Unavailable information is identified instead of automatically being treated as negative.
- Data freshness: Relevant sections can indicate when their underlying information may be outdated.
- Incomplete analysis: If a specialist encounters a problem, the remaining report can still be generated.
- Data validation: Basic checks help identify missing or invalid values before the analysis proceeds.
- AI availability: If certain AI-generated explanations cannot be produced, supported fallback mechanisms keep some sections available.
The report can also indicate when the current trading session is still in progress and market data may change.
Why Use a Multi-Agent Approach?
A stock's performance cannot be fully understood through a single metric.
A stock may show positive technical signals while its financial indicators raise concerns. Recent company announcements may provide additional context, while volatility can increase uncertainty.
Our multi-agent approach brings these different perspectives together in one report.
Instead of manually reviewing multiple indicators and information sources, users can explore the available findings in one place and understand where the evidence agrees or conflicts.
Start Analyzing Your Stock
Our AI-Powered Multi-Agent Stock Analysis System is designed to make stock research more accessible by combining market information, financial metrics, technical indicators, news, corporate activities, and candlestick patterns.
To get started, select a stock symbol, generate the report, review the findings, and explore the Balanced View for additional context.
The objective is to help you understand the available evidence, identify potential risks, and explore different perspectives before making your own decisions.
Disclaimer: This report is intended for educational and informational purposes only. It does not constitute investment advice or a recommendation to buy, sell, or hold any security. Market data may be incomplete, delayed, or subject to change. Always conduct your own research before making investment decisions.